Online Course
Introduction to Business Analytics

Apply analytical techniques in practice: Master the management of successful analytics projects in large corporations

4.8

863 reviews on
17,875 students already enrolled
  • Institute of Analytics
  • The Association of Data Scientists
  • E-Learning Quality Network
  • European Agency for Higher Education and Accreditation
  • Global Association of Online Trainers and Examiners

Skill level:

Basic

Duration:

6 hours
  • Lessons (5 hours)
  • Practice exams (45 minutes)

CPE credits:

7.5
CPE stands for Continuing Professional Education and represents the mandatory credits a wide range of professionals must earn to maintain their licenses and stay current with regulations and best practices. One CPE credit typically equals 50 minutes of learning. For more details, visit NASBA's official website: www.nasbaregistry.org

Accredited

certificate

What you learn

  • Manage stakeholders’ expectations effectively within your organization.
  • Identify KPIs and metrics to set realistic, impactful business targets.
  • Apply analysis methodologies to practical, real-world business scenarios.
  • Gain a clear understanding of end-to-end processes in large corporations.
  • Master the phases of the analytics lifecycle and business process mapping.

Topics & tools

Data AnalysisBusiness AnalyticsTheoryProcess MappingStakeholder MappingBusiness SkillsExcel

Your instructor

Course OVERVIEW

Description

CPE Credits: 7.5 Field of Study: Specialized Knowledge
Delivery Method: QAS Self Study
Business analytics offers a unique perspective on how world-class organizations use data-driven decision making as a tool for success. Throughout the course, you will develop the practical skills you need to manage a successful analytics project. The step-by-step modules take you all the way from stakeholder and process mapping, through end-to-end processes and benchmarking, to hands-on analytical techniques, including historical analysis, variance analysis, trend analysis, value-based analysis, correlation, time series, regression, as well as machine and deep learning analysis. Once you finish the course, you will have a good idea how these techniques can be applied in practice, allowing you to thrive in any corporate environment.

Prerequisites

  • No prior experience or knowledge is required. We will start from the basics and gradually build your understanding. Everything you need is included in the course
  • All you need is a spreadsheet software or a programming tool to follow along

Advanced preparation

  • None

Curriculum

54 lessons 14 exercises 4 exams
  • 1. Setting the scene
    16 min
    The first section of the course teaches you the fundamentals of how companies develop short- and long-term expectations, why that is necessary, and how businesses set up a system to monitor their performance.
    16 min
    The first section of the course teaches you the fundamentals of how companies develop short- and long-term expectations, why that is necessary, and how businesses set up a system to monitor their performance.
    What does the course cover? Free
    Managing expectations of different stakeholder groups Free
    Preparing an annual business plan and a long-range plan Free
    Exercise Free
    Analytics vs analysis Free
    Exercise Free
  • 2. Understanding your business
    17 min
    Here, you will gain an in-depth understanding of the mechanics of the entire process through practical examples. You will learn more about the various groups of stakeholders, their expectations, and how these are translated into the long-range plan and the annual business plan.
    17 min
    Here, you will gain an in-depth understanding of the mechanics of the entire process through practical examples. You will learn more about the various groups of stakeholders, their expectations, and how these are translated into the long-range plan and the annual business plan.
    Introduction - understanding your business Free
    Exercise Free
    Stakeholder mapping Free
    Defining business intelligence Free
    Exercise Free
    End-to-end process mapping (part 1) Free
    Exercise Free
    End-to-end process mapping (part 2) Free
    Exercise Free
  • 3. An in-depth view of end-to-end processes in a corporation
    12 min
    An in-depth view of end-to-end processes in a corporation - Hire-to-Retire (H2R), Record-to-Report (R2R), Order-to-Cash (O2C), Source-to-Pay (S2P)
    12 min
    An in-depth view of end-to-end processes in a corporation - Hire-to-Retire (H2R), Record-to-Report (R2R), Order-to-Cash (O2C), Source-to-Pay (S2P)
    Hire-to-retire (H2R)
    Source-to-Pay (S2P)
    Record-to-report (R2R)
    Order-to-Cash (O2C)
    Global process owners - Conclusion
    Exercise
    Practice exam
  • 4. Target setting
    35 min
    This section is dedicated to target-setting. You will learn how to identify key value drivers, what are metrics, and what distinguished metrics and KPIs. This part of the course also explains internal and external benchmarking, as well as the importance of the Master data governance function.
    Identifying a firm's key value drivers
    Exercise
    Metrics vs KPIs
    Exercise
    Define your metrics
    Exercise
    The benchmarking exercise
    The importance of data
    The master data governance function
  • 5. Maturity stages in analytics
    24 min
    An introduction of the different stages of analysis and a high-level overview of the types of analytics techniques that can be implemented in each of these stages within a company’s day to day activities. This section provides you with an excellent holistic framework about the descriptive, predictive, and prescriptive types of analytics implemented by businesses in different industries around the world. Once you complete the section, you will have a good understanding of what can be done in different situations and how these analytics can create value for your organization.
    Introduction - maturity stages in analytics
    Descriptive analytics
    Diagnostic analytics
    Predictive analytics
    Prescriptive analytics
    Practice exam
  • 6. Analytics techniques in practice
    96 min
    A closer look into the topic where you will improve your understanding of trend analysis, comparative analysis, and value-based analysis through relevant practical examples. Further on, the section covers time-series correlation and regression analysis, and you will get familiar with some of the more advanced techniques that are rapidly increasing in popularity, such as business decision trees, machine learning, and natural language processing.
    Introduction - analysis techniques in practice
    Trend analysis
    Trend analysis in Excel
    Comparative analysis
    Comparative analysis in Excel
    Value-based analysis
    Value-based analysis in Excel
    Correlation analysis
    Correlation analysis in Excel
    Time series analysis
    Time series analysis in Excel
    Regression analysis
    Regression analysis in Excel
    Machine learning analysis
    Types of machine learning
    Conclusion
  • 7. Analytics life cycle
    49 min
    This last section focuses on project management and reveals some critical success factors which you can bear in mind when working on your own analytical project. We will go through a Step-By-Step plan showing how to execute a project by reviewing each of the six phases of the analytics project's lifecycle: the hypothesis development phase, situation analysis, current state analysis, the blueprint and design phase, the build and test phase, and the deploy and operationalize phase.
    Introduction - analytics lifecycle
    Hypothesis development
    Situational analysis
    Building a RACI matrix
    What makes for a successful project?
    Current state analysis
    Blueprint and design
    Build and test
    Build and test: step-by-step
    Deploy and operationalise: operationalise-and-operationalise
    Practice exam
  • 8. Data visualization for business analytics
    8 min
    In this section, you will learn how to create powerful data visualizations to communicate your message. As BI tools are winning popularity, people are less interested in getting information from long pages of text. You will understand how to tell a story in a format that is easy to read and, quite importantly, gives your audience clear answers without the help of an analyst.
    Data visualization
  • 9. Practical case study
    23 min
    In this section of the course, we will blend the knowledge acquired in the previous lessons with a practical exercise that shows how the principles covered so far can be applied in a real-life situation. We will study how the Supply Chain division of a company works and how business analytics helps run operations smoothly.
    Practical case study (part 1)
    Practical case study (part 2)
  • 10. Course exam
    40 min
    40 min
    Course exam

Free lessons

What does the course cover?

1.1 What does the course cover?

5 min

Managing expectations of different stakeholder groups

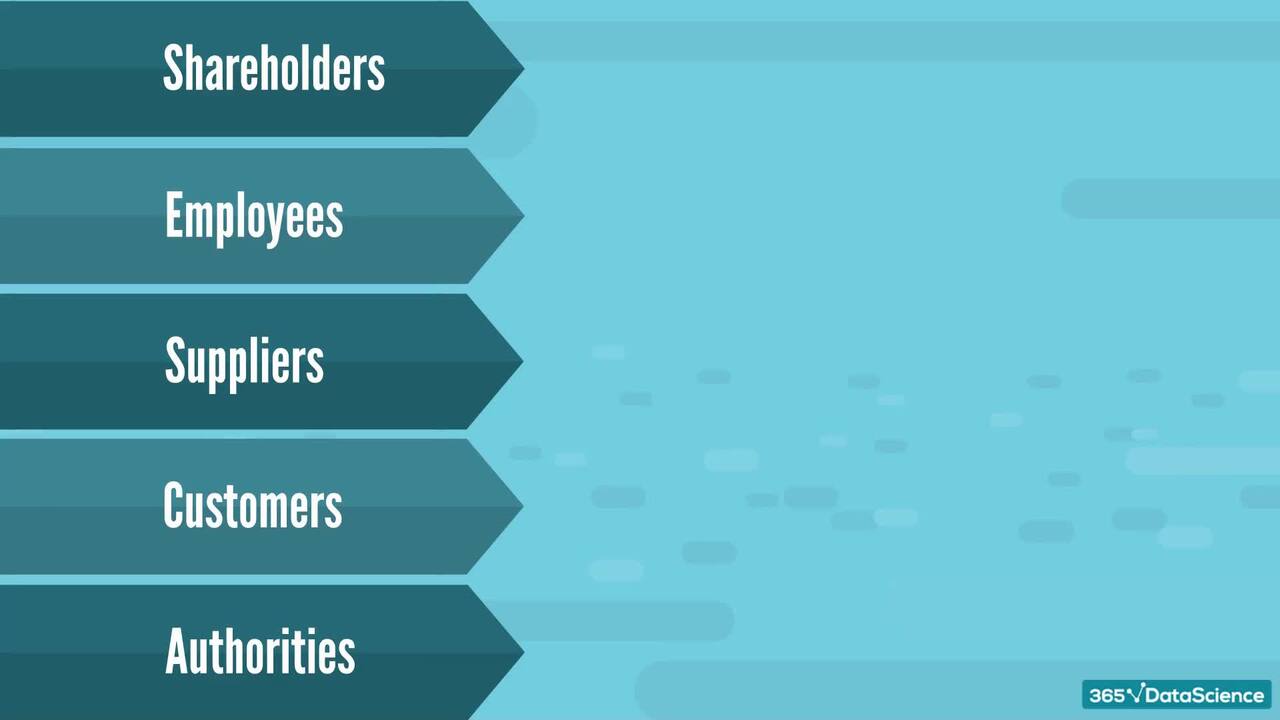
1.2 Managing expectations of different stakeholder groups

4 min

Preparing an annual business plan and a long-range plan

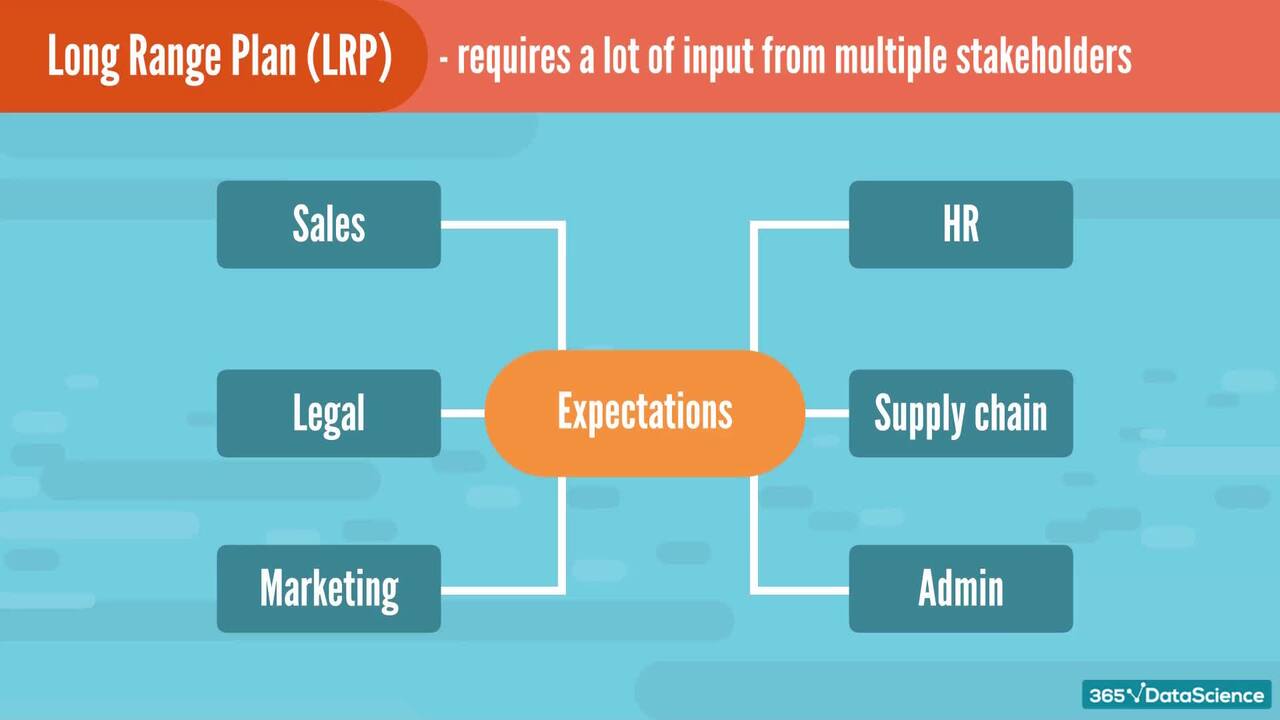
1.3 Preparing an annual business plan and a long-range plan

5 min

Analytics vs analysis

1.5 Analytics vs analysis

2 min

Introduction - understanding your business

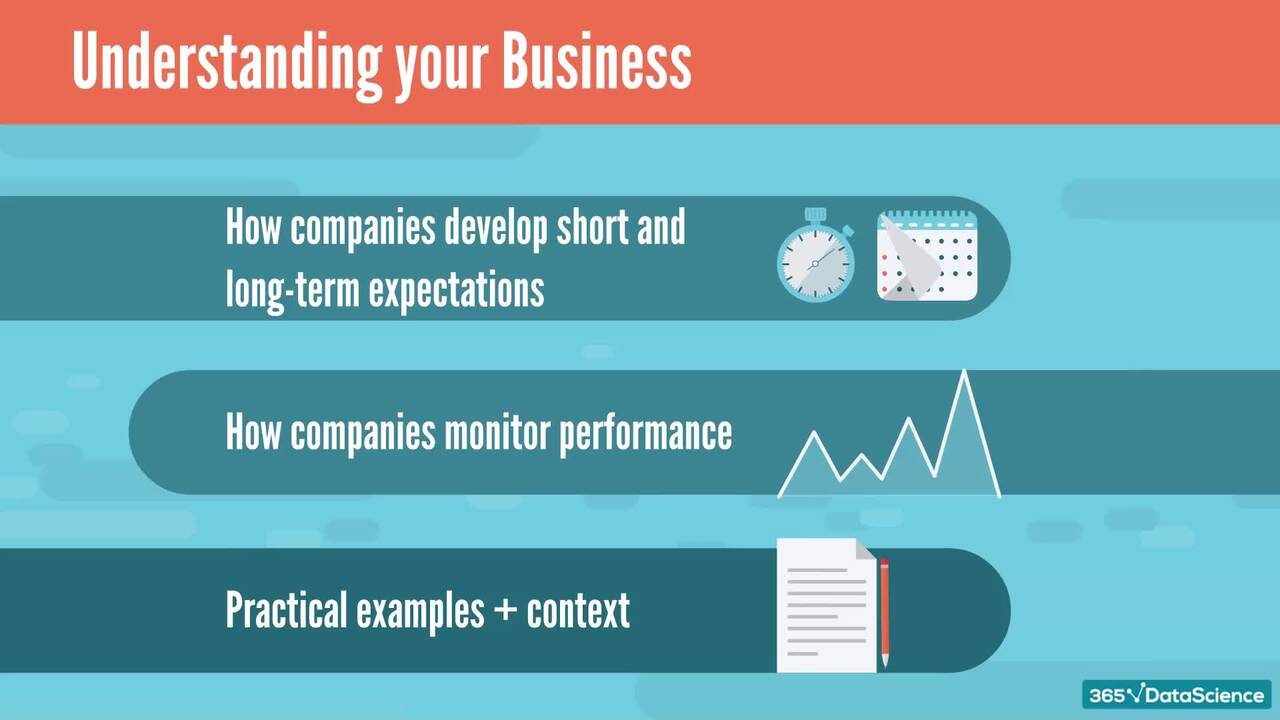
2.1 Introduction - understanding your business

1 min

Stakeholder mapping

2.3 Stakeholder mapping

3 min

Start for free

4.8

Based on 863 reviews

#1 most reviewed

AI and data learning platform on Trustpilot.

94%

of AI and data science graduates

successfully change

or advance their careers.

96%

of our students recommend

365 Data Science.

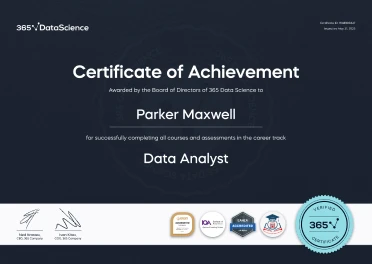
ACCREDITED certificates

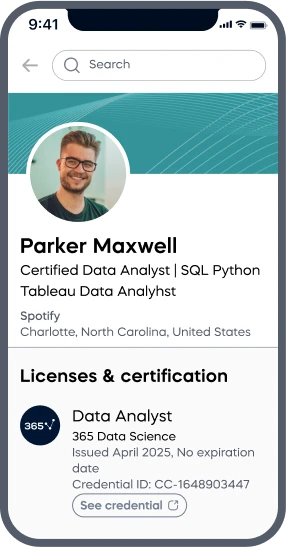
Craft a resume and LinkedIn profile you’re proud of—featuring certificates recognized by leading global institutions.

Earn CPE-accredited credentials that showcase your dedication, growth, and essential skills—the qualities employers value most.

  • Institute of Analytics
  • The Association of Data Scientists
  • E-Learning Quality Network
  • European Agency for Higher Education and Accreditation
  • Global Association of Online Trainers and Examiners

Certificates are included with the Self-study learning plan.

A LinkedIn profile mockup on a mobile screen showing Parker Maxwell, a Certified Data Analyst, with credentials from 365 Data Science listed under Licenses & Certification. A 365 Data Science Certificate of Achievement awarded to Parker Maxwell for completing the Data Analyst career track, featuring accreditation badges and a gold “Verified Certificate” seal.

How it WORKS

  • Lessons
  • Exercises
  • Projects
  • Practice exams
  • AI mock interviews

Lessons

Learn through short, simple lessons—no prior experience in AI or data science needed.

Try for free

Exercises

Reinforce your learning with mini recaps, hands-on coding, flashcards, fill-in-the-blank activities, and other engaging exercises.

Try for free

Projects

Tackle real-world AI and data science projects—just like those faced by industry professionals every day.

Try for free

Practice exams

Track your progress and solidify your knowledge with regular practice exams.

Try for free

AI mock interviews

Prep for interviews with real-world tasks, popular questions, and real-time feedback.

Try for free

Student REVIEWS

A collage of student testimonials from 365 Data Science learners, featuring profile photos, names, job titles, and quotes or video play icons, showcasing diverse backgrounds and successful career transitions into AI and data science roles.