Melina A.
See all reviews
Unleash your data storytelling with Power BI Data Visualization Hero. This hands-on beginner course is your fast-track introduction to the world of business intelligence and dashboard design.


Skill level:
Duration:
CPE credits:
Accredited
Bringing real-world expertise from leading global companies
Engineer's Degree, Information Technology, Ural State Technical University
Description
You’ll learn how to turn raw data into clear and impactful visuals using Microsoft Power BI—no coding needed. Through real-world examples, interactive practice, and expert insights, you'll master the essentials: reporting fundamentals, charts fine-tuning, KPI cards design and creation, slicers, filters and interactions configuration, and how to put it all together step-by-step. No prior experience with Power BI is required—the first section will guide you through the main interface. Ideal for aspiring analysts, managers, sales specialists, office workers and anyone tired of spreadsheets and Excel tables—this course will help you build dashboards that speak for themselves.
Power BI Desktop is available for Windows but not for MacOS. If you’re using MacOS, you can use a virtual machine (VM) for Power BI Desktop on the Mac. Or if you have a corporate MS account, feel free to use the Power BI Web Version.
Curriculum
This section explores the real-world challenges of choosing the right charts—not just from theory, but in a way that resonates with your audience. You’ll learn how to balance best practices with user preferences and how to justify your visualization choices clearly and convincingly to both data-minded analysts and visually driven stakeholders.
This section explores the real-world challenges of choosing the right charts—not just from theory, but in a way that resonates with your audience. You’ll learn how to balance best practices with user preferences and how to justify your visualization choices clearly and convincingly to both data-minded analysts and visually driven stakeholders.
The KPI Cards section focuses on how to effectively display key performance indicators for immediate impact. You’ll learn the difference between business-defined KPIs and simple summary metrics, and how to design cards that clearly communicate the most important figures at a glance.
The KPI Cards section focuses on how to effectively display key performance indicators for immediate impact. You’ll learn the difference between business-defined KPIs and simple summary metrics, and how to design cards that clearly communicate the most important figures at a glance.
This section introduces one of Power BI’s most essential interactive tools—slicers. You’ll learn how to create and customize slicers to filter your visuals effectively, enhancing user control and making your dashboards truly interactive.
This section introduces one of Power BI’s most essential interactive tools—slicers. You’ll learn how to create and customize slicers to filter your visuals effectively, enhancing user control and making your dashboards truly interactive.
The last section of the course brings together all the core visuals—charts, cards, tables, and slicers—into one cohesive, interactive dashboard. You’ll explore the fundamentals of layout, composition, and design logic to ensure your reports are not just functional, but intuitive and impactful.
The last section of the course brings together all the core visuals—charts, cards, tables, and slicers—into one cohesive, interactive dashboard. You’ll explore the fundamentals of layout, composition, and design logic to ensure your reports are not just functional, but intuitive and impactful.
A video guide on assembling a dashboard: from setting up visuals to organizing the layout for clear and effective reporting. This section summarizes and walks you through all the steps you've learned to assemble your dashboard.
A video guide on assembling a dashboard: from setting up visuals to organizing the layout for clear and effective reporting. This section summarizes and walks you through all the steps you've learned to assemble your dashboard.
9 in 10
people walk away career-ready
94%
of AI and data science graduates
successfully change
$29,000
average salary increase
ACCREDITED certificates
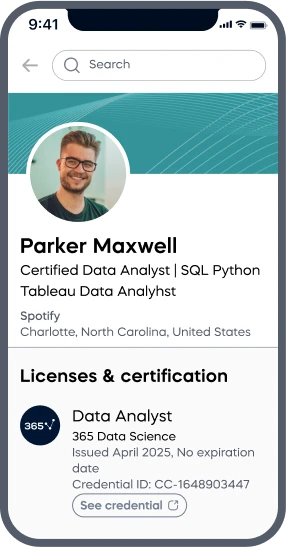
Craft a resume and LinkedIn profile you’re proud of—featuring certificates recognized by leading global
institutions.
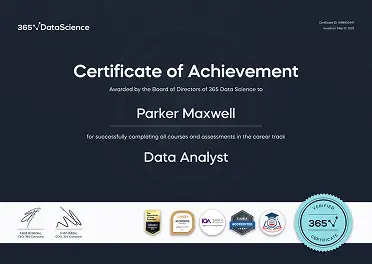
Earn CPE-accredited credentials that showcase your dedication, growth, and essential skills—the qualities
employers value most.


Certificates are included with the Self-study learning plan.


How it WORKS