Introduction to Tableau

with Ned Krastev
4.8/5
(1,730)

Start your Tableau journey and learn how to create professional data visualizations in Tableau

3 hours of content 39133 students

$99.00

Lifetime access

Buy now
14-Day Money-Back Guarantee

What you get:

  • 3 hours of content
  • 8 Interactive exercises
  • 31 Downloadable resources
  • World-class instructor
  • Closed captions
  • Q&A support
  • Future course updates
  • Course exam
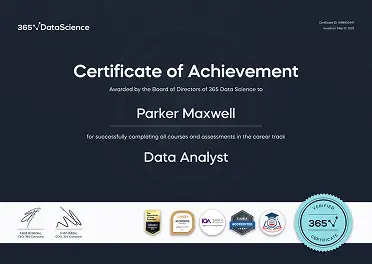
  • Certificate of achievement

Introduction to Tableau

A course by Ned Krastev

$99.00

Lifetime access

Buy now
14-Day Money-Back Guarantee

What you get:

  • 3 hours of content
  • 8 Interactive exercises
  • 31 Downloadable resources
  • World-class instructor
  • Closed captions
  • Q&A support
  • Future course updates
  • Course exam
  • Certificate of achievement

$99.00

Lifetime access

Buy now

$99.00

Lifetime access

Buy now
14-Day Money-Back Guarantee

What you get:

  • 3 hours of content
  • 8 Interactive exercises
  • 31 Downloadable resources
  • World-class instructor
  • Closed captions
  • Q&A support
  • Future course updates
  • Course exam
  • Certificate of achievement

What You Learn

  • Learn Tableau fundamentals
  • Create data visualizations in a professional BI tool
  • Become familiar with Tableau’s interface and key features
  • Learn how to use key Tableau tools such as joins, data blending, custom calculations, filters, charts, and dashboards
  • Create professional-looking Tableau dashboards
  • Apply your skills in practice by solving a real-world dashboard task in Tableau

Top Choice of Leading Companies Worldwide

Industry leaders and professionals globally rely on this top-rated course to enhance their skills.

Course Description

Do you want to learn how to use the world’s number one BI tool? Would you like to learn how to work competently in Tableau in just a few hours? If that’s the case, then this is the perfect Tableau training for you! Get a quick introduction to Tableau’s interface and how it can help you create interactive dashboards and professional data visualizations. The course starts from the very basics and gradually shows you how to work with Tableau’s main tools. This Tableau training stands out because it teaches you how to use the software with real-world data and business use cases. The practical case study at the end of the Tableau course will help you reinforce everything you have learned in the initial lessons consolidating your knowledge. Even if you have never opened Tableau before, please don’t worry. The Intro to Tableau tutorials we have prepared are designed to guide you from the ground up. Join us on a journey that will introduce you to key Tableau features such as data interpretation, joins, and data blending. Learn how to create charts and tables in Tabeau and how to add custom calculations. Gain the flexibility to build real-world dashboards and interactive filters. Format your work professionally and follow Tableau best practices. Earn a Tableau certificate recognized by employers and boost your resume. How is this Intro to Tableau training different than the rest? 1. Content quality The course stands out than other introductory Tableau trainings because it starts from the ground up and teaches you Tableau by showing how to solve real-world business problems every step of the way. We are not going to just show you the Tableau interface and list the functionalities the software has. Instead, we will use Tableau as a tool to solve real-world tasks and challenges. 2. Instructor The instructor in this course, Ned Krastev, brings a wealth of analyst experience and business knowledge. His methodical step-by-step approach will guide you through the lessons and will ensure you will learn how to work in Tableau professionally. 3. Certificate of achievement If you compete the Intro to Tableau training and pass successfully its course exam, you will be awarded a verifiable certificate of achievement, which is a testament to your dedication and hard work. Click the ‘Buy now’ button and start this amazing learning journey today! Make an investment that will boost your resume and career.

Learn for Free

Welcome to Tableau

1.1 Welcome to Tableau

1 min

Why use Tableau: Make your data make an impact

1.2 Why use Tableau: Make your data make an impact

4 min

Let's download Tableau Public

1.4 Let's download Tableau Public

2 min

Connecting data in Tableau

1.5 Connecting data in Tableau

2 min

Exploring Tableau's interface

1.6 Exploring Tableau's interface

9 min

Exploring Tableau's interface

1.7 Exploring Tableau's interface

1 min

Curriculum

  • 1. Introduction to Tableau
    7 Lessons 26 Min

    While Tableau is an indispensable tool in the arsenal of most corporate business intelligence analysts, data analysts, and data scientists, many people are uncertain about the difference between Tableau and spreadsheet tools like Excel. In this part of the course, you will learn when and why you need Tableau, as well as the difference between Tableau and other spreadsheet tools. We will also get you started by showing you how to install Tableau Public (Tableau’s free version).

    Welcome to Tableau
    1 min
    Why use Tableau: Make your data make an impact
    4 min
    Let's download Tableau Public
    2 min
    Connecting data in Tableau
    2 min
    Exploring Tableau's interface
    9 min
    Exploring Tableau's interface Read now
    1 min
    Let's create our first chart in Tableau!
    7 min
  • 2. Tableau Functionalities
    12 Lessons 28 Min

    In this section, you will create your first Tableau charts and tables. We will teach you how to create basic charts and adjust parts of their appearance. By the end of this section, you will be able to use many of Tableau's core functionalities, like creating custom fields, adding calculations to a table, adding totals and subtotals, and adding a filter.

    Creating a table
    5 min
    Creating a table - link Read now
    1 min
    Creating custom fields
    2 min
    Creating a custom field and adding calculations to a table
    4 min
    Creating a custom field and adding calculations to a table - link Read now
    1 min
    Adding totals and subtotals
    2 min
    Adding totals and subtotals - link Read now
    1 min
    Adding a custom calculation
    3 min
    Adding a custom calculation - link Read now
    1 min
    Inserting a filter
    2 min
    Inserting a filter - link Read now
    1 min
    Working with joins in Tableau
    5 min
  • 3. The Tableau Exercise
    20 Lessons 52 Min

    This section is a practical example that will help you apply your skills in practice with real data. The exercise is divided into two parts. In the first part, we will test several ways to connect our data. You already studied joins in SQL. Here, you will see how to apply joins in a Tableau context. You will also learn about data blending, and current best practices. By the end of the exercise, you will create three charts. Each of these charts analyzes a different aspect of a real-life dataset. We will group the charts in a dashboard and add a filter, applying it to all three charts at the same time.

    Introduction to the exercise
    2 min
    Let's create a dashboard - Visualizing the three charts we want to create
    2 min
    Using Joins in Tableau
    6 min
    Performing a Numbers Check - Attempt #1
    4 min
    Performing a Numbers Check - Attempt #1 - link Read now
    1 min
    Blending Data in Tableau
    6 min
    Blending Data in Tableau - link Read now
    1 min
    Performing a Numbers Check - Attempt #2
    4 min
    Performing a Numbers Check - Attempt #2 - link Read now
    1 min
    First chart
    4 min
    First chart - link Read now
    1 min
    Second chart
    3 min
    Second chart - link Read now
    1 min
    Third Chart
    3 min
    Third Chart - link Read now
    1 min
    Creating and Formatting a Dashboard
    4 min
    Creating and Formatting a Dashboard - link Read now
    1 min
    Adding Interactive Filters for Improved Analysis
    4 min
    Adding Interactive Filters for Improved Analysis - link Read now
    1 min
    Interactive filters - fix
    2 min

Topics

TheoryTableaudata analysisdata visualization

Tools & Technologies

tableau

Course Requirements

  • No prior experience or knowledge is required. We will start from the basics and gradually build your understanding. Everything you need is included in the course
  • You will need to install Tableau Public (free software)

Who Should Take This Course?

Level of difficulty: Beginner

  • Tableau beginners
  • Aspiring analysts and people who want a career in Business Intelligence

Exams and Certification

A 365 Data Science Course Certificate is an excellent addition to your LinkedIn profile—demonstrating your expertise and willingness to go the extra mile to accomplish your goals.

Exams and certification

Meet Your Instructor

Ned Krastev

Ned Krastev

CEO at

24 Courses

34738 Reviews

406761 Students

Nedko earned a Master’s degree in Finance from Bocconi University (Milan, Italy) in 2012. Then, he gained valuable working experience with exciting firms like PwC Italy (Financial Advisory and M&A), Coca-Cola European Partners (Financial Analyst), and Infineon Technologies (M&A). In 2014, he published his first online course on financial modeling and valuation when he realized that creating educational materials is his true calling. The amazing students and content creators in the data science community, the 365 team, and the strong desire to build the perfect learning platform drive Nedko to continue on this exciting journey. His goal is to establish 365 Data Science as the learning platform that bridges the gap between theoretical knowledge and practical business application.

What Our Learners Say

365 Data Science Is Featured at

Our top-rated courses are trusted by business worldwide.