
Vladyslav P.
After 365:
Data Scientist | ING Tech Poland
See all reviews
Learn how to work with Excel pivot tables and create world-class reports, interactive dashboards, and insightful analyses


Skill level:
Duration:
CPE credits:
Accredited

Bringing real-world expertise from leading global companies


Master's degree, Finance

Description
Pivot tables are essential Excel tools for analyzing large datasets—crucial for every analyst, especially early in their career.
This Excel pivot table course covers fundamental and advanced skills. We'll begin with basic tables and pivot table fundamentals, then progress to editing data sources and updating pivot table content. We’ll also introduce the GETPIVOTDATA function, which allows you to extract data from your pivot table reports.
This leads us to the second part of the course, which features a comprehensive real-world case study showing you how to create an interactive and flexible business report using pivot tables and slicers. This real-life example sets this course apart because it equips you with the ability to craft world-class business reports—a skill that will distinguish you in any company.
The Excel data analysis course suits graduates and young professionals lacking practical experience with Excel pivot tables. It’s also highly recommended for analysts without practical training who have not designed interactive dashboards and business reports with pivot tables. No experience with Excel and pivot tables? No problem! Our pivot table course covers all the essentials, starting from the basics.
Why is this one of the top online pivot table courses?
Hundreds of online Excel pivot table courses exist, yet few match the depth of this training. You'll master pivot table creation and manipulation and gain essential data analysis skills for crafting world-class business reports.
Join us for a transformative journey where you'll learn to create, edit, and format pivot tables, work with GETPIVOTDATA and slicers, enhance report layouts and structures, and master extracting data from pivot tables.
In just a few hours, gain the practical skills that top professionals at leading companies have mastered over the years.
Click the 'Buy Now' button to embark on an incredible learning journey and transform your career.
Curriculum
Free lessons

1.1 Introduction to the course
1 min
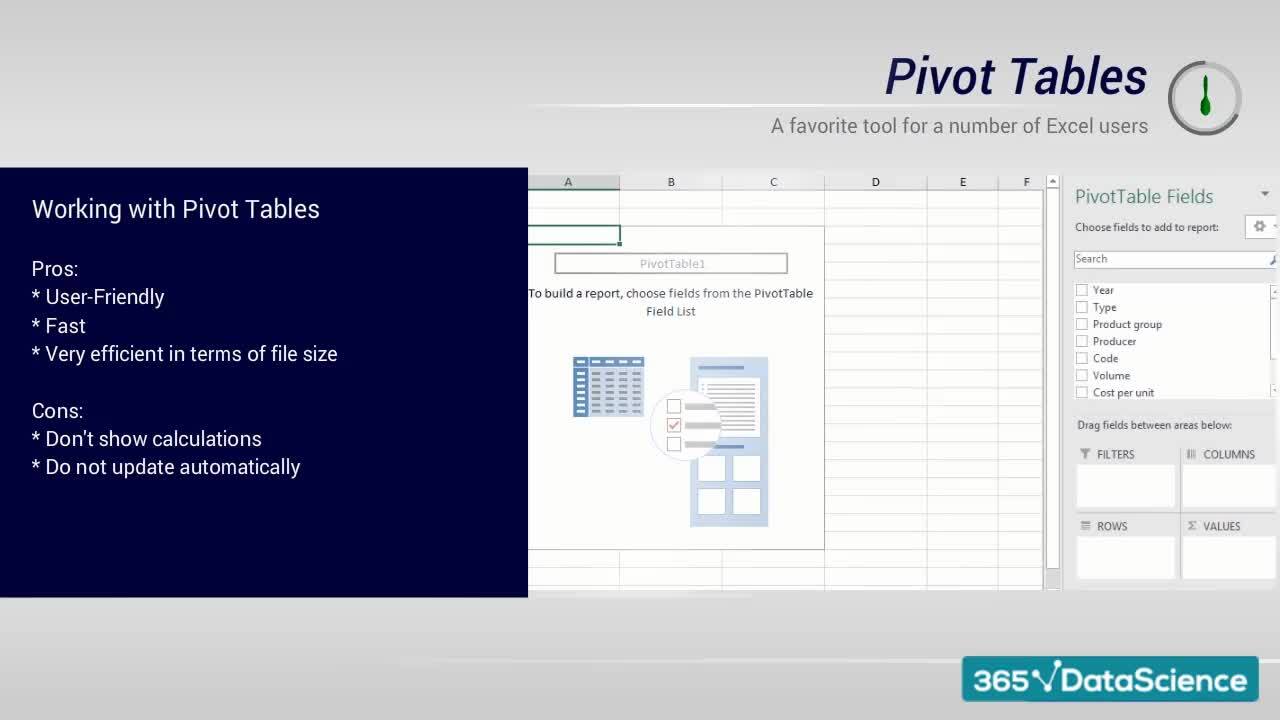
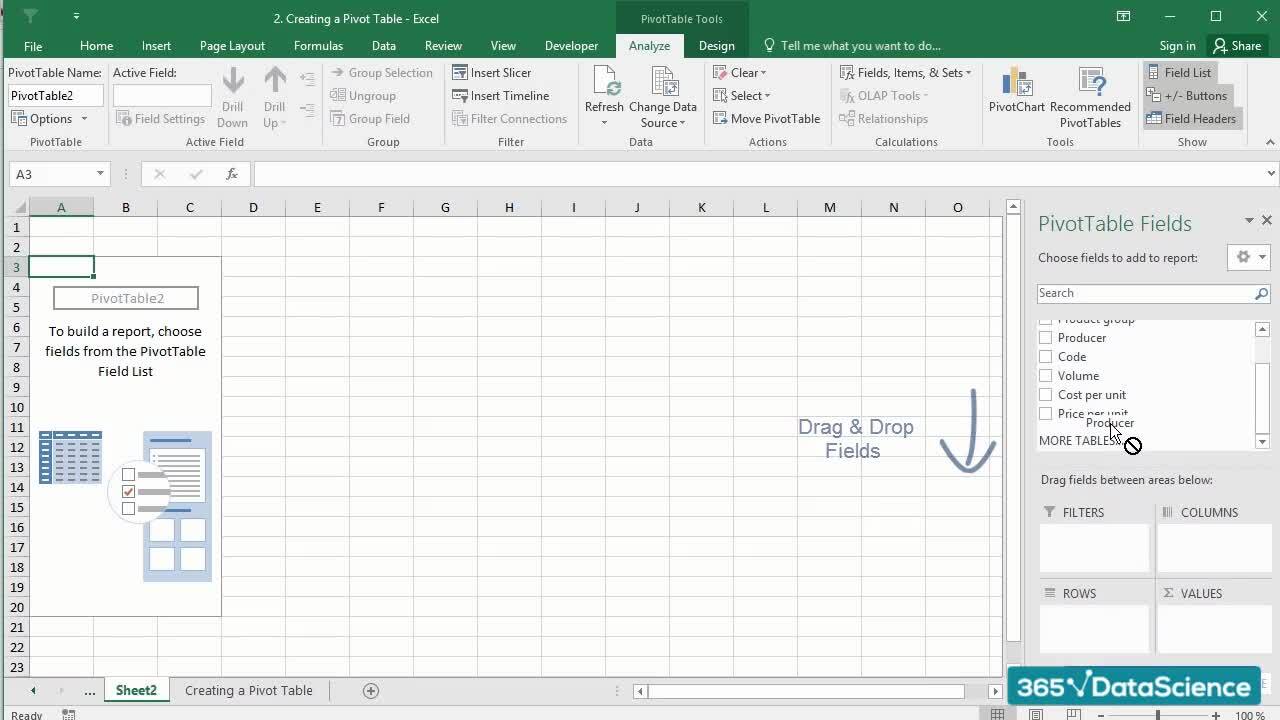
1.2 Intro to Pivot tables
2 min
1.3 Editing a Pivot table
4 min
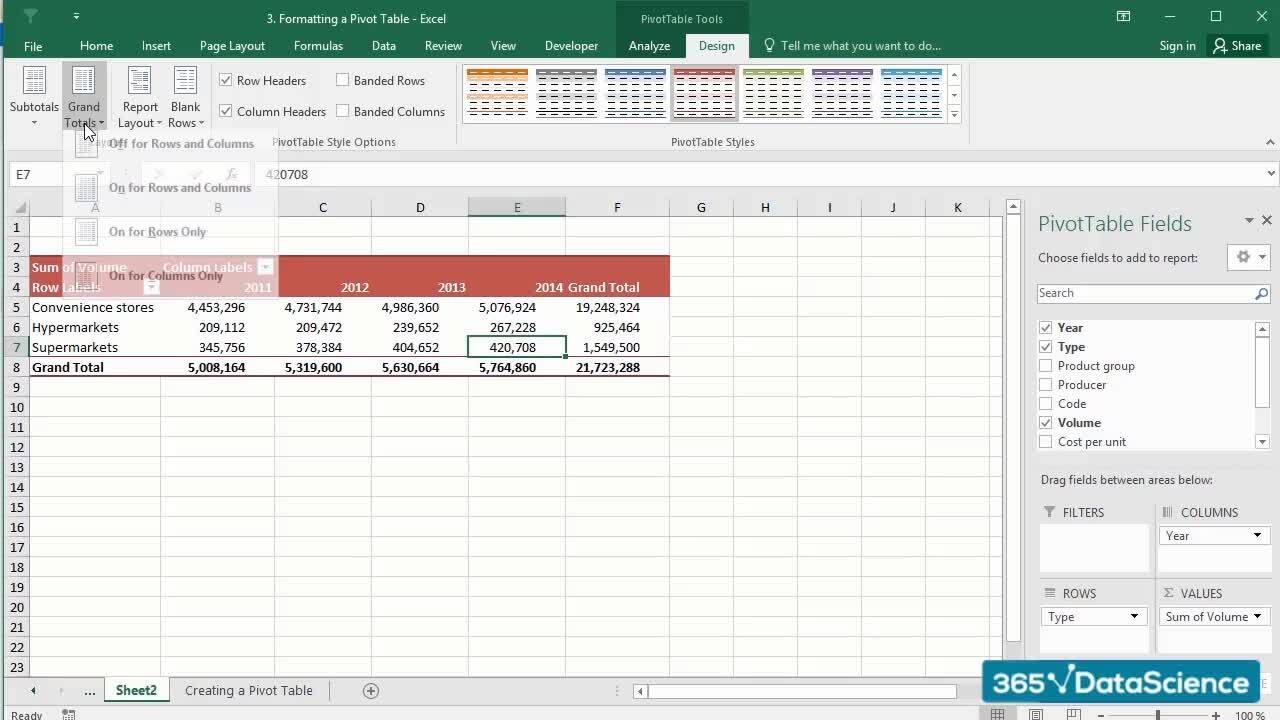
1.5 Formatting a Pivot table
2 min
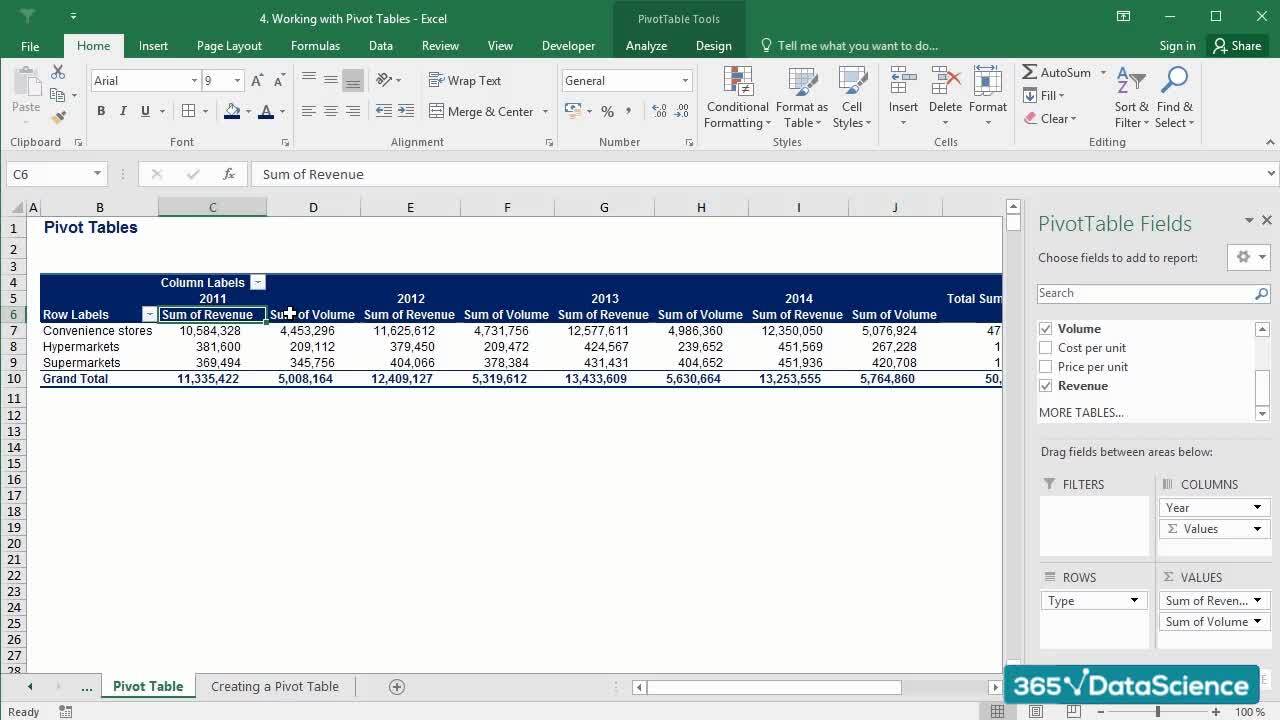
1.6 Adjusting a Pivot table
4 min
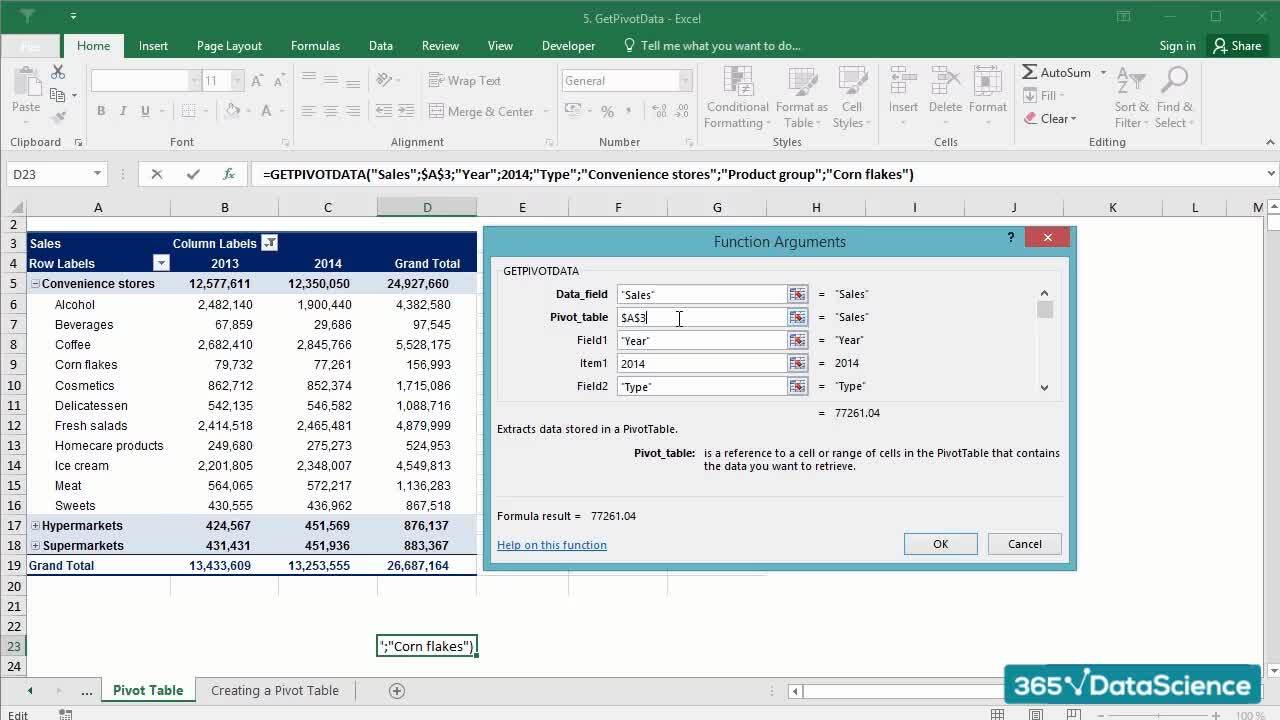
1.8 GETPIVOTDATA
3 min
#1 most reviewed
9 in 10
of our graduates landed a new AI & data job
$29,000
average salary increase
ACCREDITED certificates
Craft a resume and LinkedIn profile you’re proud of—featuring certificates recognized by leading global
institutions.
Earn CPE-accredited credentials that showcase your dedication, growth, and essential skills—the qualities
employers value most.
Certificates are included with the Self-study learning plan.

How it WORKS
Student REVIEWS