
Yolibeth A.
Before 365:
BDR | United Language Group
After 365:
Marketing Analyst | Laboratorio Vida y Salud
See all reviews
Go from beginner to pro in Power Bi with this comprehensive Power Bi course that will teach you the skills needed on the job. Learn how to work with the most popular BI tool in the world


Skill level:
Duration:
CPE credits:
Accredited

Bringing real-world expertise from leading global companies


Bachelor's degree, Advertising and Marketing

Description
Do you want to take the perfect Power BI training that will get you from beginner to professional? Would you like to learn how to work confidently in Power BI in several hours? If so, then this is the perfect Power BI course for you! It takes several years in the workplace to acquire Power BI proficiency. The process can be stressful and frustrating. Learning from YouTube tutorials isn’t perfect either – instructors don’t offer a structured approach and rarely have extensive business experience. This Power BI training offers you an opportunity to take the fast track to Power BI proficiency. It starts from the very basics and introduces more advanced problems in our signature step-by-step approach. You will be surprised how much progress you will make in a few short hours. The secret lies in the fact that the course relies on a proven formula. We will introduce Power BI features and will show you how to use them to solve real-world business problems. The course instructor, Dimitar Shutev, is an industry veteran who knows how to guide you throughout the learning journey. He boasts an impressive data analyst, BI analyst, and data engineer resume having worked for various multi-billion-dollar listed firms. This Power BI training is suitable for graduates and young professionals who are Power BI beginners and want to learn how to work with the world’s most popular BI tool. It is highly recommended for analysts who have been on the job for a few years but still need to improve their skills and adopt best practices. Even if you don’t have any Power BI skills until now, don’t worry. This course is designed to guide you from the ground up. Join us on a journey that will teach you how to setup Power BI in Windows and in Mac. Then you will learn how to connect to various data sources. The course gives you a solid introduction to data modeling and DAX. You will learn useful aspects such as working with calculated columns, Snowflake schema, using filters, iterators, and logical operators. Moreover, by going through the course case studies you will learn indispensable Power BI tools such as slicers, chart formatting, conditional formatting, and more. This is a complete training that builds your skills from the ground up and teaches you everything you’ll need to get hired and excel on the job. How is this Power BI course different than the rest? 1. Real-world problems Most Power BI tutorials give you an intro to the Power BI interface and show you how to create different types of charts inside the software. This course will do more than that. It will provide the necessary introduction to Power BI, but it will also teach you how to solve real-world problems. In fact, if you go through the course curriculum, you will see that it teaches Power BI by solving real-world problems step-by-step. You will have the chance to practice alongside the instructor and by the end of the training you will acquire Power BI proficiency. 2. Content quality The Power BI course you are about to take has been carefully planned and scripted. The content in every lecture builds on what you have learned previously. Experience a structured teaching stye that will ensure you will stay engaged and productive throughout the entire Power BI learning journey. 3. Certificate of achievement If you compete the Power BI course and pass successfully its course exam, you will be awarded a verifiable certificate of achievement, which is a testament to your dedication and hard work. Click the ‘Buy now’ button and start this amazing learning journey today! Make an investment now that could change your entire career.
Curriculum
Free lessons
1.1 Introduction to Power BI
3 min
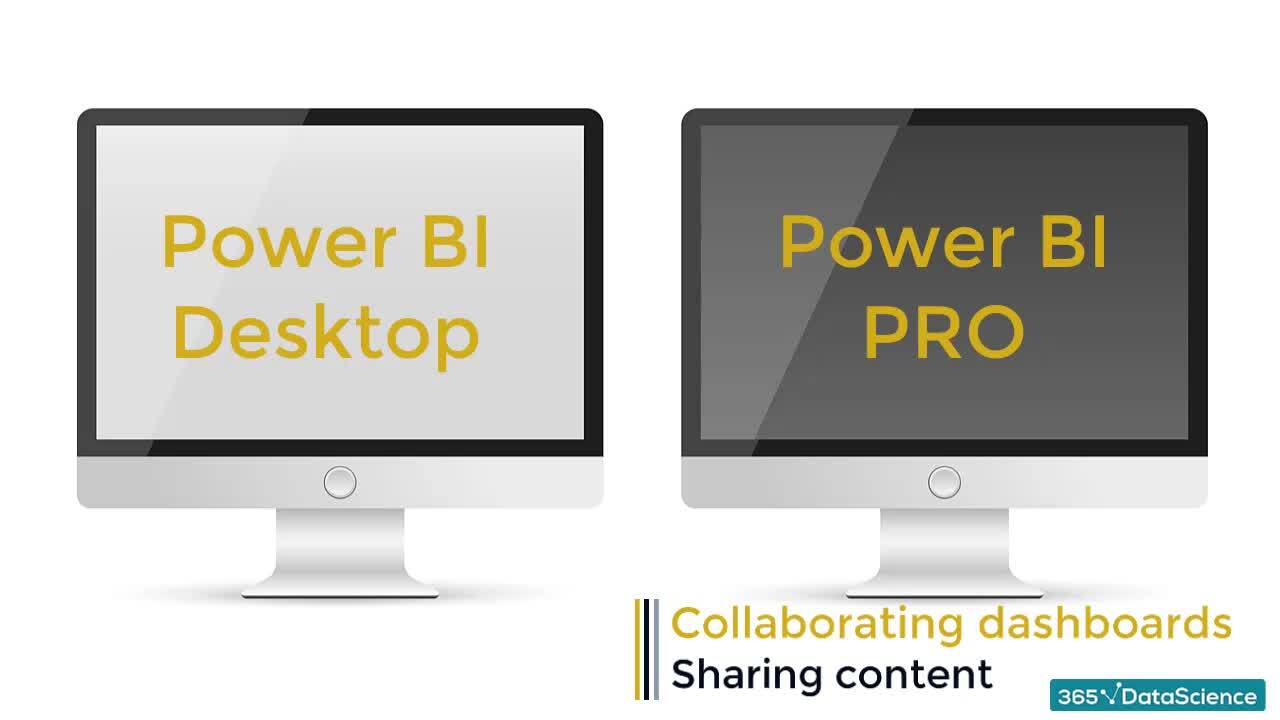
1.2 Power BI Desktop vs Power BI Pro
2 min
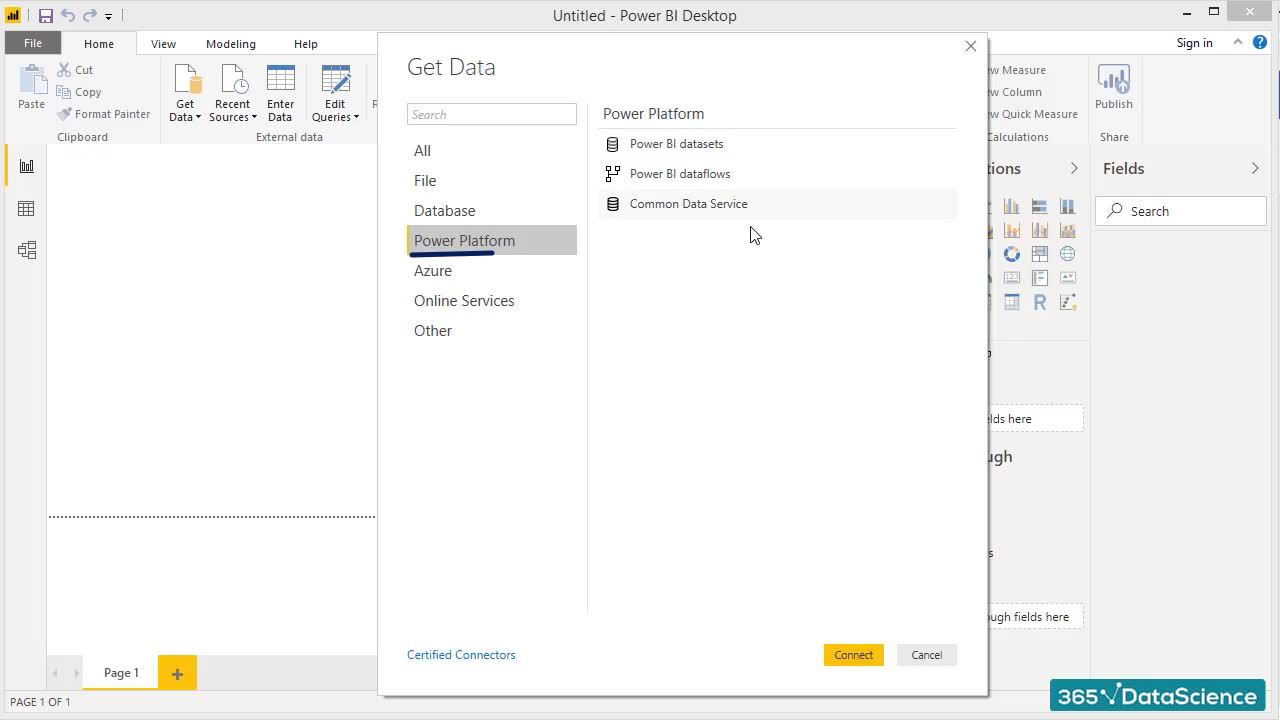
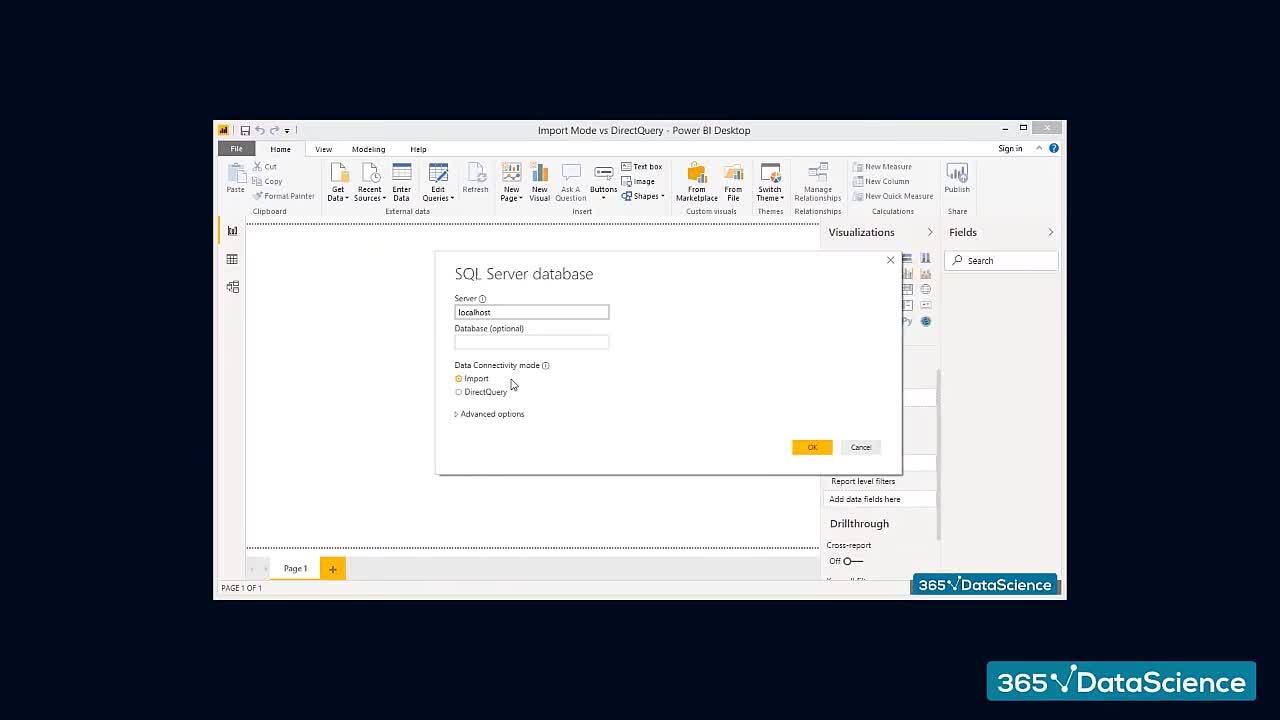
1.3 Power BI data sources
2 min
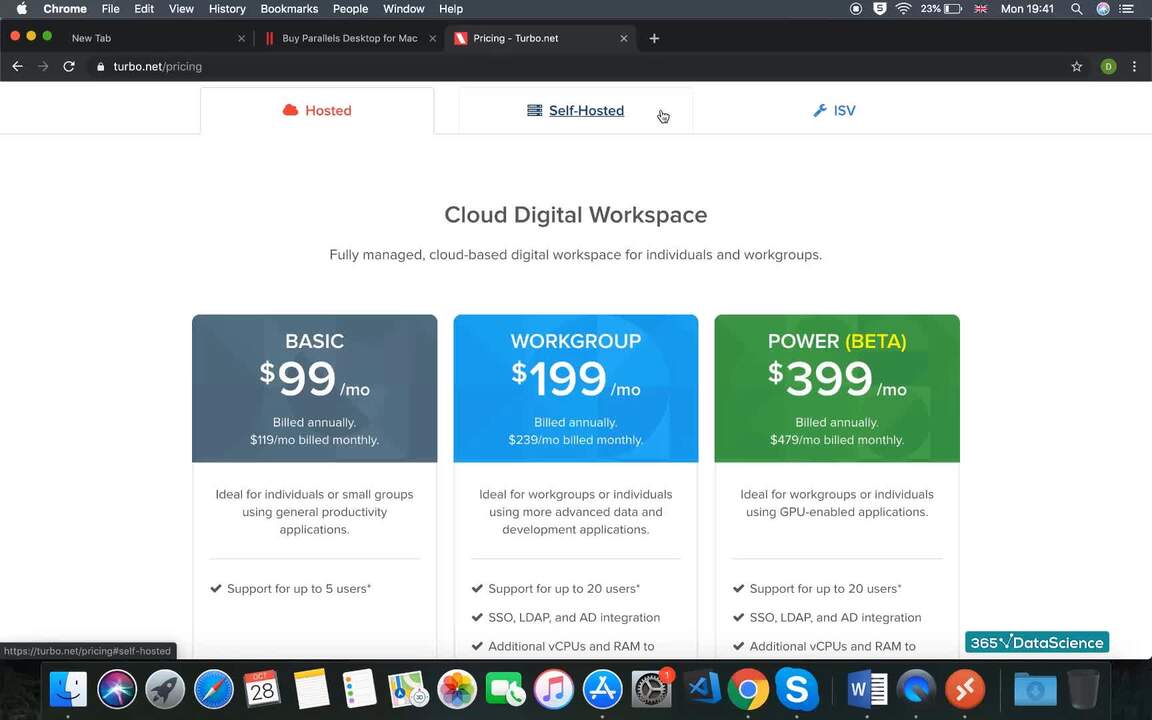
2.1 Power BI for MAC
6 min
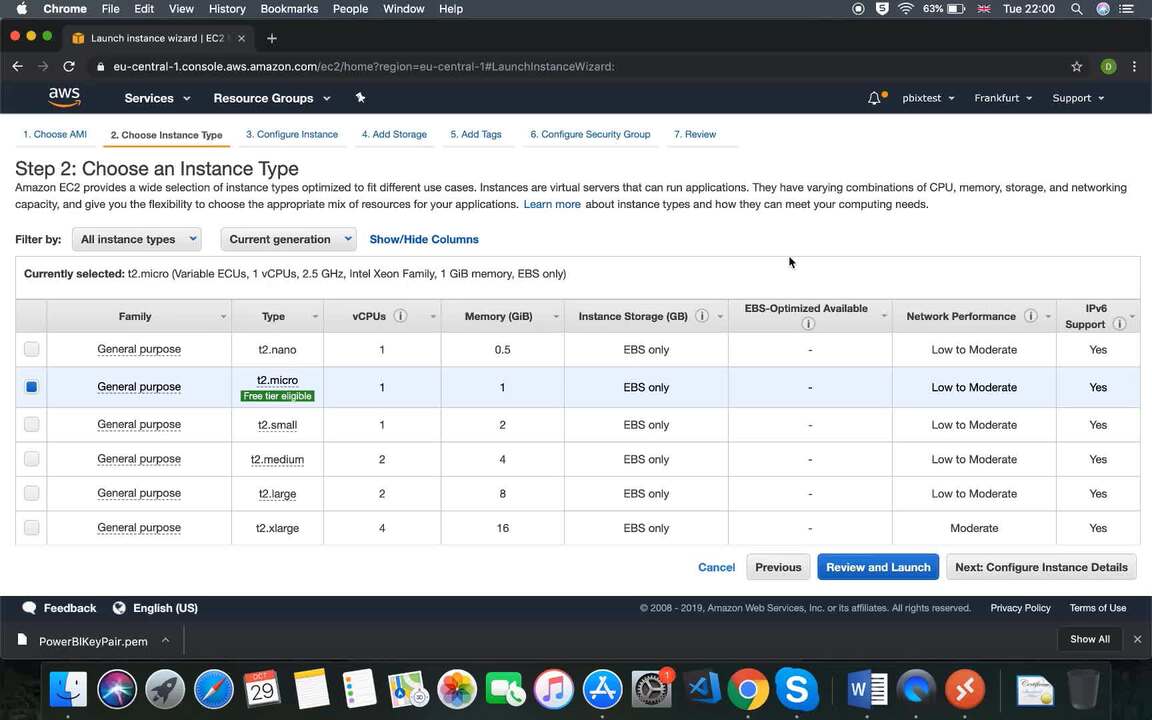
2.2 Power BI for Mac Part 2
7 min
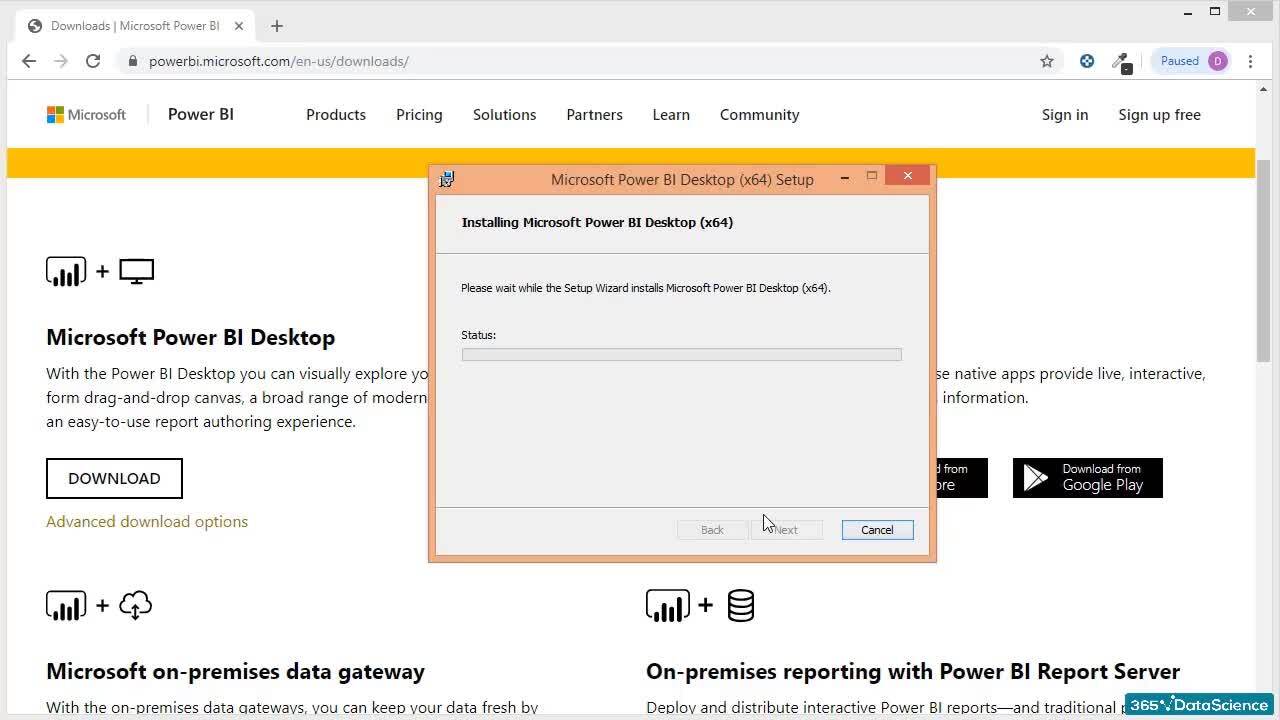
2.3 How to Install Power BI
3 min
$29,000
average salary increase
9 in 10
people walk away career-ready
96%
of our students recommend
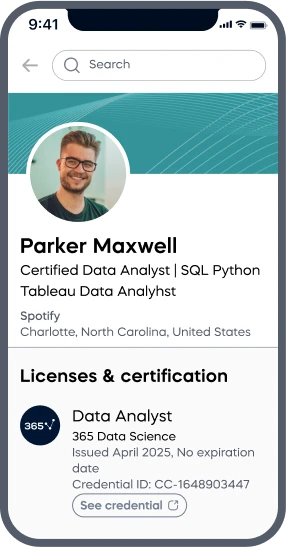
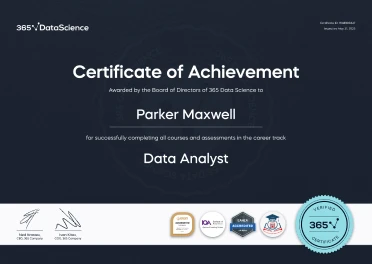
ACCREDITED certificates
Craft a resume and LinkedIn profile you’re proud of—featuring certificates recognized by leading global
institutions.
Earn CPE-accredited credentials that showcase your dedication, growth, and essential skills—the qualities
employers value most.
Certificates are included with the Self-study learning plan.
How it WORKS
Student REVIEWS