Online Course
Introduction to R Programming

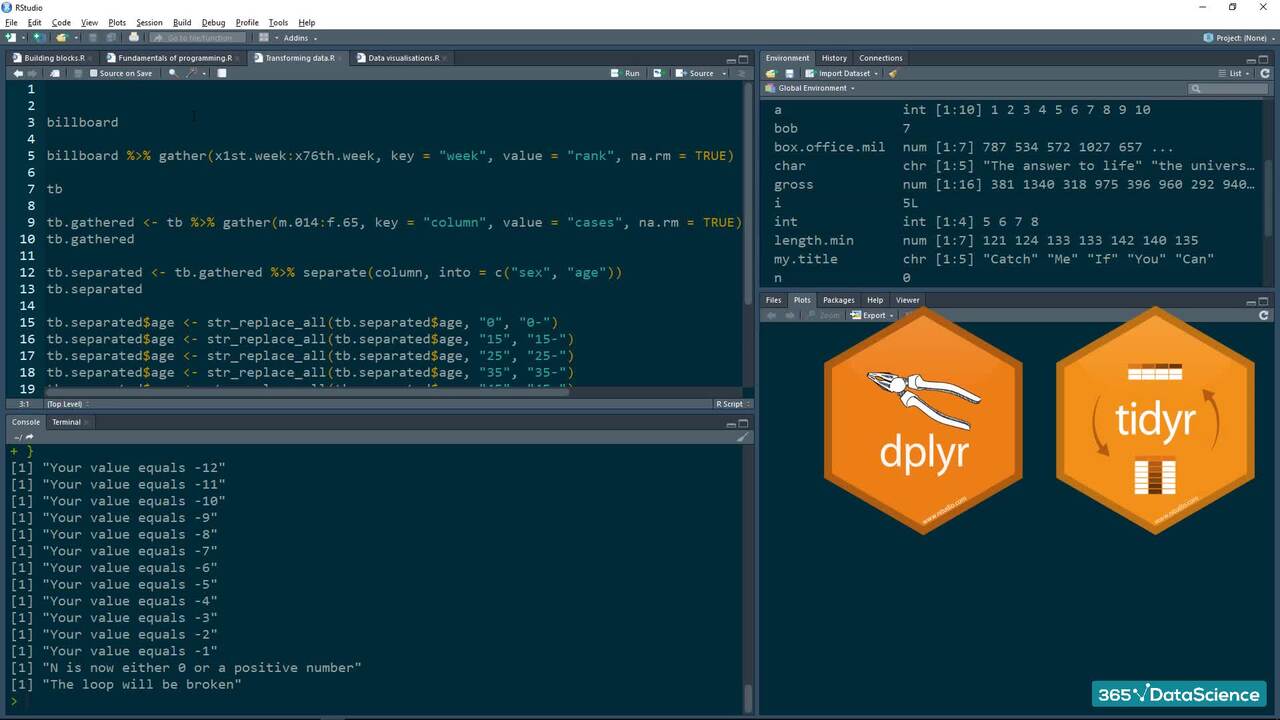
Master R programming for data science: manipulate, analyze, and visualize data with the best programming language for statistical analysis

4.8

862 reviews on
19,384 students already enrolled
  • Institute of Analytics
  • The Association of Data Scientists
  • E-Learning Quality Network
  • European Agency for Higher Education and Accreditation
  • Global Association of Online Trainers and Examiners

Skill level:

Basic

Duration:

6 hours
  • Lessons (6 hours)
  • Projects (7 hours)

CPE credits:

8.5
CPE stands for Continuing Professional Education and represents the mandatory credits a wide range of professionals must earn to maintain their licenses and stay current with regulations and best practices. One CPE credit typically equals 50 minutes of learning. For more details, visit NASBA's official website: www.nasbaregistry.org

Accredited

certificate

What you learn

  • Get a comprehensive introduction to the world of R programming.
  • Write well-structured and professional R code in RStudio.
  • Create, import, and manipulate data frames, vectors, and matrices.
  • Learn how to use R for statistical analysis and data visualization.
  • Solve hypothesis testing and linear regression tasks in R.

Topics & tools

ProgrammingData AnalysisData VisualizationData ProcessingR

Your instructor

Course OVERVIEW

Description

CPE Credits: 8.5 Field of Study: Information Technology
Delivery Method: QAS Self Study
R is one of the best programming languages specifically designed for statistics and graphics. Programming in R is a fast and effective way to perform advanced data analyses and manipulations. In this course, you will learn how to use R and utilize the many data analysis techniques, methods, and functions it has to offer to the professional data scientist.

Prerequisites

  • R (latest version from cran.r-project.org) and RStudio (free version available at posit.co)

Advanced preparation

  • None

Curriculum

87 lessons 60 exercises 1 project 1 exam
  • 1. Introduction & Getting Started
    24 min
    In this introductory part of the course, we will go for a walk in the R environment. First, we are going to install R and RStudio together. Then, we’ll dive straight into RStudio and learn about its interface, and how to make use of the main windows and tabs there. We will also talk about setting your working directory and getting additional help.
    What does this course cover Free
    What does section 1 cover Free
    Downloading and installing R and RStudio Free
    Quick guide to the RStudio user interface Free
    Exercise Free
    Coding exercise Free
    Changing the appearance of RStudio Free
    Installing packages and using the library Free
  • 2. The building blocks of R
    33 min
    In this section, you will learn about objects and coercion rules in R, functions in R, and how to use R’s console. Not only that, but by the end of the section, you will have built your first function; it will be able to draw cards from a deck, so you can play your favorite board game even if you don’t have the physical cards in front of you.
    Creating an object in R Free
    Coding exercise Free
    Data types in R (Integers and doubles) Free
    Exercise Free
    Coding exercise Free
    Data types in R (Characters and logicals) Free
    Coding exercise Free
    Coercion rules in R Free
    Exercise Free
    Coding exercise Free
    Functions in R Free
    Coding exercise Free
    Functions and arguments Free
    Coding exercise Free
    Building a function in R Free
    Coding exercise Free
    Using the script vs. using the console Free
  • 3. Vectors and vector operations
    29 min
    Now that we have covered the basics, in this section, we are about to drill deeper into R’s most widely used object type – the vector. You will learn how to create vectors and how to perform vector arithmetic operations. You will also see how to index and access elements from a vector, and how vectors recycle. Then, you will see how to change the dimensions of a vector and create a two-dimensional object from it. That will be our nice little segue into matrices.
    What does section 3 cover
    Introduction to vectors
    Coding exercise
    Vector recycling
    Naming a vector
    Exercise
    Exercise
    Coding exercise
    Exercise
    Getting help with R
    Slicing and indexing a vector
    Coding exercise
    Changing the dimensions of an object in R
    Coding exercise
  • 4. Matrices
    48 min
    In this section, you will learn how to create and rename matrices, and how to index and slice matrices. All of this will lay a super solid foundation for the big star of data analysis: the data frame. Not only that, but we will also talk about factors, which are related to the statistics part of the course. Finally, we will cover lists: R’s way of storing hierarchical data.
    Creating a matrix
    Coding exercise
    Faster code - creating a matrix in a single line of code
    Coding exercise
    Do matrices recycle
    Indexing an element from a matrix
    Coding exercise
    Slicing a matrix
    Coding exercise
    Matrix arithmetic
    Coding exercise
    Matrix operations
    Coding exercise
    Categorical data
    Creating a factor in R
    Coding exercise
    Lists in R
    Coding exercise
  • 5. Fundamentals Of Programming With R
    43 min
    In this section of the course, we will go through some of the fundamental tools you need to learn when programming with R (and many other programming languages). We will cover relational operators, logical operators, vectors, IF, ELSE, and different types of loops (for, while, and repeat) in R. Some of these topics will have already been introduced to you in our Python training, but here you will have the chance to reinforce what you have learned and see things with R in mind.
    Relational operators in R
    Coding exercise
    Logical operators in R
    Coding exercise
    Logical operators and vectors
    Coding exercise
    If else else-if statements
    Coding exercise
    If else else-if keep-in-minds's
    For loops in R
    Coding exercise
    While loops in R
    Coding exercise
    Repeat loops in R
    Coding exercise
    Building a function in R 2.0
    Coding exercise
    Building a function in R 2.0 Scoping
    Coding exercise
  • 6. Data frames in R
    36 min
    In this section, we will focus our attention on how to create and import data frames into R. How to quickly get a sense of your data frame by using the str() function, summary(), col-and row-names, and so on. We’ll learn about accessing individual elements of your data frame for further use. And about extending a data frame with either new observations or variables (or row and columns). Furthermore, we will talk about dealing with missing data because in real life that happens more often than we’d like. And we’ll discuss exporting data frames once we’re happy with their general state and are ready to share them with the world.
    What does section 6 cover
    Creating a data frame
    Coding exercise
    The Tidyverse package
    Data import into R
    Coding exercise
    Importing a CSV into R
    Data export in R
    Getting a sense of your data frame
    Coding exercise
    Indexing and slicing a data frame in R
    Coding exercise
    Extending a data frame in R
    Coding exercise
    Dealing with missing data
    Coding exercise
  • 7. Manipulating data with R
    25 min
    Here, we will be talking about data transformation with the dplyr package. More specifically, how to filter(), arrange(), mutate(), and transmute() your data, as well as how to sample() fractions and a fixed number of elements from it. You will also learn what tidy data is, why it is extremely important for the efficiency of your work to tidy your data sets in the most meaningful way, and how to achieve this by using the tidyr package. You will be tidying several messy real-life data sets, and you will learn how to combine multiple operations in an intuitive way by using the pipe operator.
    What does section 7 cover
    Data transformation with R - the Dplyr package - Part I
    Data transformation with R - the Dplyr package - Part II
    Sampling data with the Dplyr package
    Using the pipe operator
    Tidying your data - gather() and separate()
    Tidying your data - unite() and spread()
  • 8. Visualizing data with R
    42 min
    Plotting and graphing data is the most elegant way to understand your data and present your findings to others. In this section, we are going to learn about the grammar of graphics and the seven layers that comprise a visualization. Then, we will jump straight into creating graphs and plots, with the ggplot2 package. Starting with the histogram, we will continue on to the bar chart, then onto the box and whiskers plot, and finally, the scatterplot. You will notice that with each new type of plot, you will also be learning about a new layer or two while getting familiarized with ggplot2 and its inner workings in an incremental way.
    What does section 8 cover
    Intro to data visualisation
    Intro to ggplot2
    Variables revisited
    Building a histogram with ggplot2
    Building a bar chart with ggplot2
    Building a box and whiskers plot with ggplot2
    Building a scatterplot with ggplot2
  • 9. Exploratory data analysis with R
    25 min
    In this part of the course, we start applying R for statistical analysis. We are ready to discuss several exploratory data analysis topics: population vs. sample; mean, median, and mode; skewness; variance, standard deviation, and the coefficient of variability; and covariance and correlation.
    Population vs Sample
    Mean, median, mode
    Coding exercise
    Skewness
    Variance, standard deviation, and coefficient of variability
    Coding exercise
    Covariance and correlation
    Coding exercise
  • 10. Hypothesis Testing
    56 min
    At this point, you are already familiar with hypothesis testing. We covered it in one of our earlier modules – Statistics. What we will do here is a natural continuation – you will learn how to carry out hypothesis testing in R.
    56 min
    At this point, you are already familiar with hypothesis testing. We covered it in one of our earlier modules – Statistics. What we will do here is a natural continuation – you will learn how to carry out hypothesis testing in R.
    Distributions
    Standard Error and Confidence Intervals
    Hypothesis Testing
    Type I and Type II errors
    Test for the mean. Population variance known
    Coding exercise
    The P-value
    Test for the mean. Population variance unknown
    Coding exercise
    Dependent samples
    Coding exercise
    Comparing two means. Independent samples
    Coding exercise
  • 11. Linear Regression Analysis in R
    25 min
    Regression analysis is another topic we covered earlier in our program. As with hypothesis testing, this is a great opportunity to apply the theory you have learned previously in R.
    25 min
    Regression analysis is another topic we covered earlier in our program. As with hypothesis testing, this is a great opportunity to apply the theory you have learned previously in R.
    The Linear Regression Model
    Correlation vs Regression
    Geometrical Representation
    Doing the Regression in R
    Coding exercise
    How to interpret the regression table
    Decomposition of variability
    R-Squared
  • 12. Course project and exam
    435 min
    435 min
    Housing Market Data Analysis in R Project
    Course exam

Free lessons

What does this course cover

1.1 What does this course cover

5 min

What does section 1 cover

1.2 What does section 1 cover

1 min

Downloading and installing R and RStudio

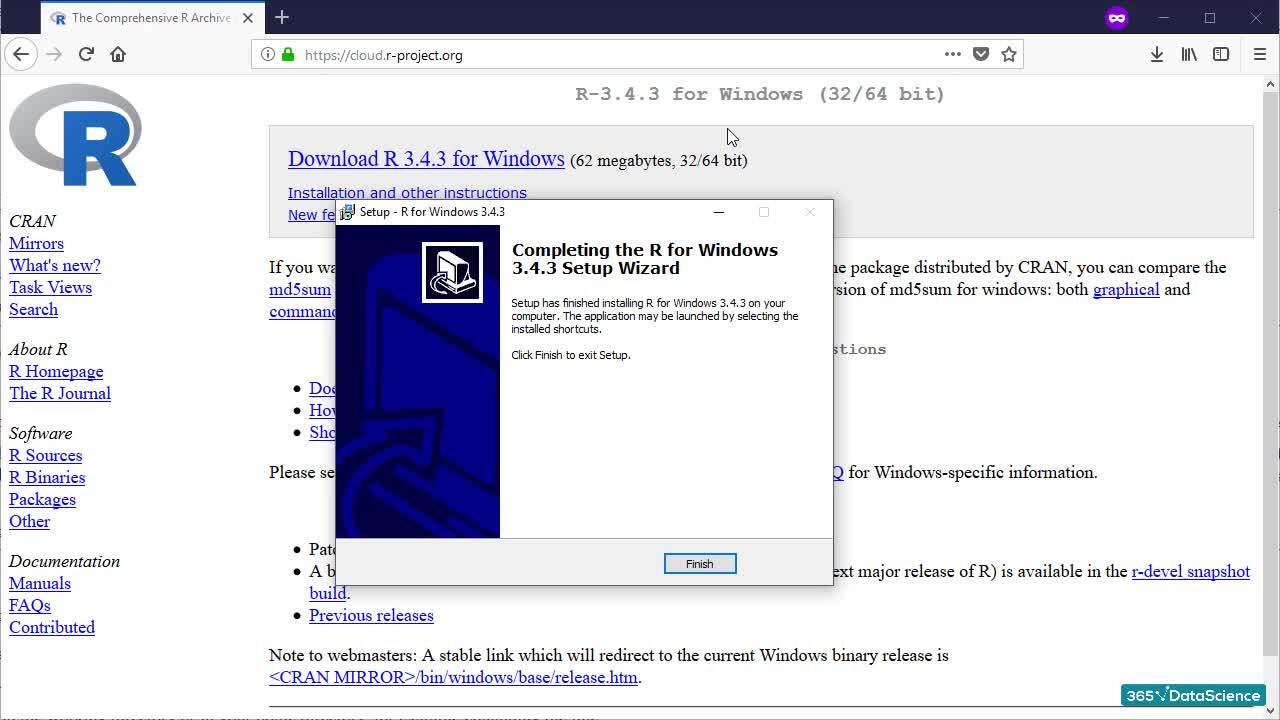
1.3 Downloading and installing R and RStudio

3 min

Quick guide to the RStudio user interface

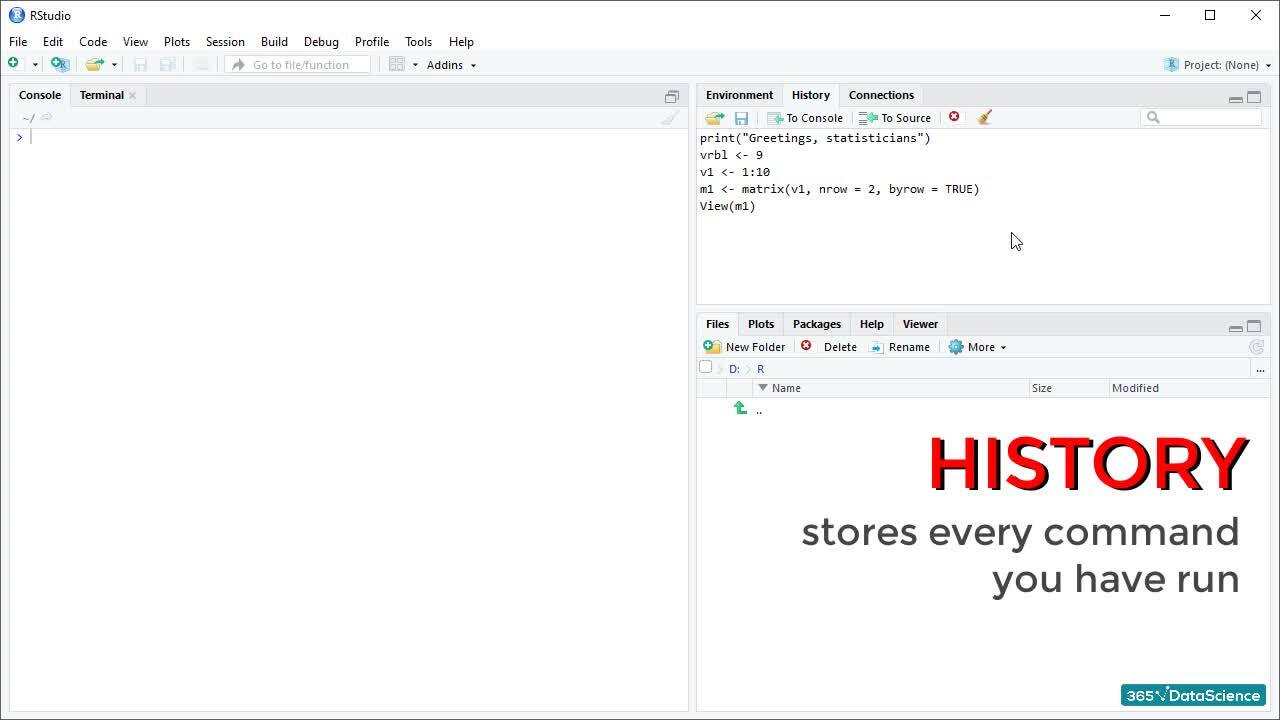
1.4 Quick guide to the RStudio user interface

8 min

Changing the appearance of RStudio

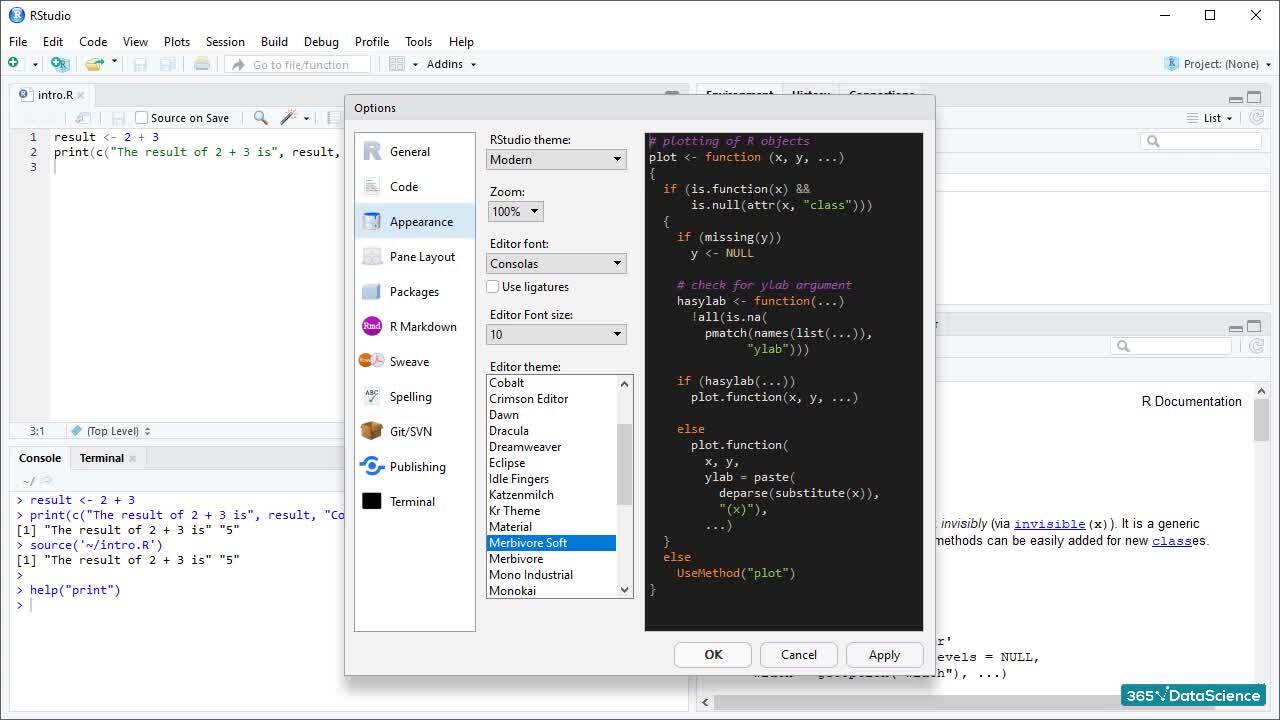
1.7 Changing the appearance of RStudio

2 min

Installing packages and using the library

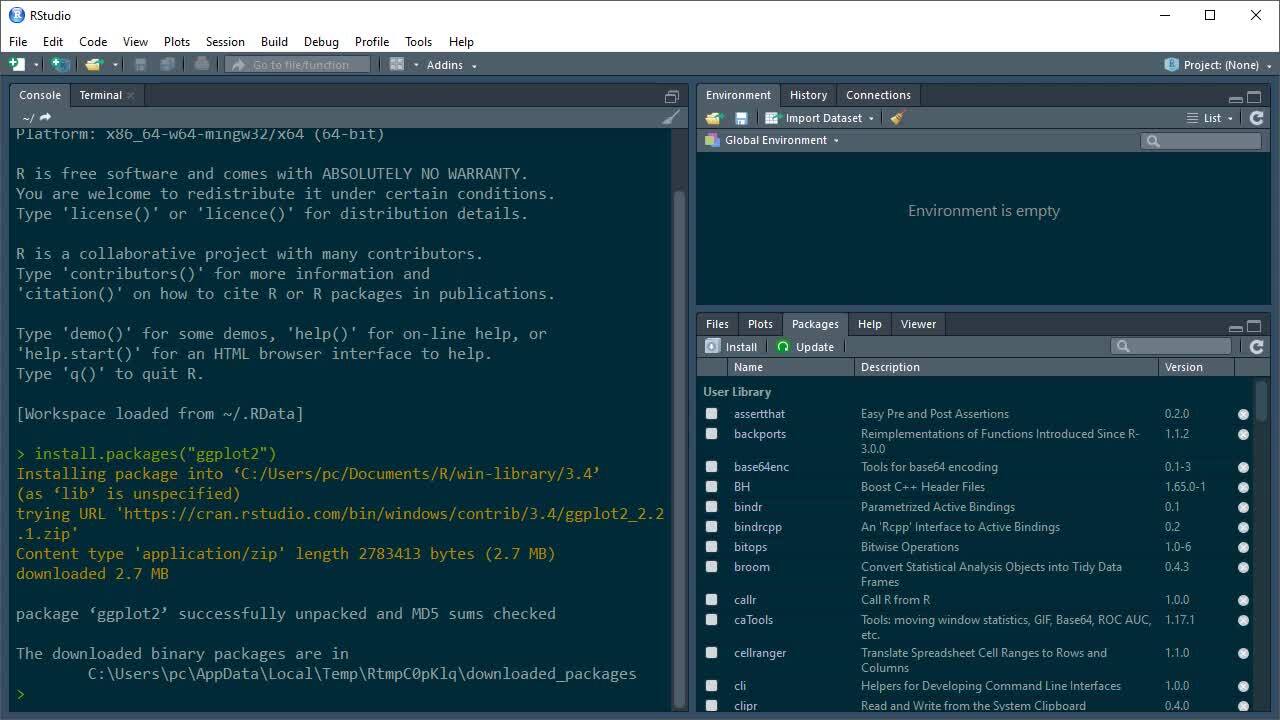
1.8 Installing packages and using the library

5 min

Start for free

96%

of our students recommend

365 Data Science.

4.8

Based on 862 reviews

#1 most reviewed

AI and data learning platform on Trustpilot.

9 in 10

people walk away career-ready

with practical data and AI skills.

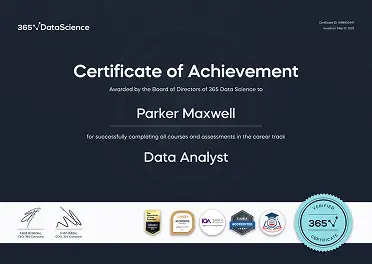
ACCREDITED certificates

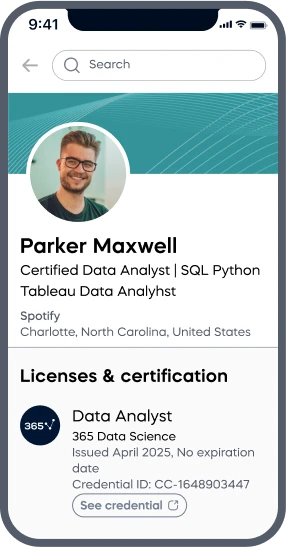
Craft a resume and LinkedIn profile you’re proud of—featuring certificates recognized by leading global institutions.

Earn CPE-accredited credentials that showcase your dedication, growth, and essential skills—the qualities employers value most.

  • Institute of Analytics
  • The Association of Data Scientists
  • E-Learning Quality Network
  • European Agency for Higher Education and Accreditation
  • Global Association of Online Trainers and Examiners

Certificates are included with the Self-study learning plan.

A LinkedIn profile mockup on a mobile screen showing Parker Maxwell, a Certified Data Analyst, with credentials from 365 Data Science listed under Licenses & Certification. A 365 Data Science Certificate of Achievement awarded to Parker Maxwell for completing the Data Analyst career track, featuring accreditation badges and a gold “Verified Certificate” seal.

How it WORKS

  • Lessons
  • Exercises
  • Projects
  • Practice exams
  • AI mock interviews

Lessons

Learn through short, simple lessons—no prior experience in AI or data science needed.

Try for free

Exercises

Reinforce your learning with mini recaps, hands-on coding, flashcards, fill-in-the-blank activities, and other engaging exercises.

Try for free

Projects

Tackle real-world AI and data science projects—just like those faced by industry professionals every day.

Try for free

Practice exams

Track your progress and solidify your knowledge with regular practice exams.

Try for free

AI mock interviews

Prep for interviews with real-world tasks, popular questions, and real-time feedback.

Try for free

Student REVIEWS

A collage of student testimonials from 365 Data Science learners, featuring profile photos, names, job titles, and quotes or video play icons, showcasing diverse backgrounds and successful career transitions into AI and data science roles.