Online Course top-rated
Machine Learning in Excel

Master the core concepts of popular ML algorithms with hands-on projects in Excel’s beginner-friendly environment

4.8

862 reviews on
9,453 students already enrolled
  • Institute of Analytics
  • The Association of Data Scientists
  • E-Learning Quality Network
  • European Agency for Higher Education and Accreditation
  • Global Association of Online Trainers and Examiners

Skill level:

Intermediate

Duration:

7 hours
  • Lessons (6 hours)
  • Practice exams (1.33 hours)
  • Projects (4 hours)

CPE credits:

9.5
CPE stands for Continuing Professional Education and represents the mandatory credits a wide range of professionals must earn to maintain their licenses and stay current with regulations and best practices. One CPE credit typically equals 50 minutes of learning. For more details, visit NASBA's official website: www.nasbaregistry.org

Accredited

certificate

What you learn

  • Acquire ML skills in a beginner-friendly environment.
  • Understand the strengths and limitations of ML models.
  • Use Excel for hands-on machine learning modeling.
  • Combine Azure and Excel to run ML experiments in the cloud.
  • Improve your career prospects with in-demand machine learning skills.

Topics & tools

Regression AnalysisMachine LearningK-Means ClusteringAzure Machine Learning StudioData AnalysisTheoryExcelLogistic RegressionDecision TreesMachine and Deep LearningSpreadsheets

Your instructor

Course OVERVIEW

Description

CPE Credits: 9.5 Field of Study: Specialized Knowledge
Delivery Method: QAS Self Study

Machine learning is one of the most in-demand skills in business today—and you don’t need to be a programmer to get started. With the right tools, you can apply powerful machine learning techniques directly in Excel to solve real-world problems.

In this Machine Learning in Excel course, you’ll learn how to build and interpret machine learning models using familiar spreadsheet functions and the Real Statistics add-in—no coding required. This hands-on course is perfect for analysts, business professionals, and students looking to gain practical machine learning experience without learning Python or R.

We begin by introducing you to the key types of machine learning: supervised and unsupervised learning. You’ll explore foundational models like linear and logistic regression, which allow you to make predictions and classify data based on historical patterns. Then, we’ll shift focus to clustering techniques, such as k-means and hierarchical clustering, used for customer segmentation and pattern recognition.

Next, you’ll learn how decision trees work by using concepts like entropy and information gain. You’ll build trees step-by-step in Excel and learn how to evaluate their predictive performance. Each technique is broken down clearly and reinforced with visual aids, Excel walkthroughs, and relatable examples.

The final section of the course introduces you to Microsoft Azure Machine Learning Studio (AMLS)—a cloud-based tool for building machine learning models using a drag-and-drop interface. You’ll build your first predictive model, deploy it as a web service, and connect it to Excel for real-time predictions.

Machine Learning in Excel is a must-have course for anyone who wants to leverage data-driven insights using tools they already know. Whether you're looking to improve decision-making, analyze customer behavior, or explore data science, this course will give you the confidence to apply machine learning in your day-to-day work. Enroll today and unlock the power of machine learning—right inside Excel.

Prerequisites

  • Microsoft Excel (any recent version, such as Excel 2019, 2021, or Microsoft 365)
  • Intermediate Excel skills are required.
  • Familiarity with basic statistics and linear algebra is helpful but not mandatory.

Curriculum

82 lessons 48 exercises 1 project 5 exams
  • 1. Introduction
    26 min
    In this introductory section, we will discuss why you need to learn advanced statistics, what sets this discipline apart from machine learning, and how you can get the most out of the Machine Learning in Excel course.
    26 min
    In this introductory section, we will discuss why you need to learn advanced statistics, what sets this discipline apart from machine learning, and how you can get the most out of the Machine Learning in Excel course.
    Course Guide and Syllabus Free
    Course Introduction Free
    What Is Machine Learning? Free
    Types of Machine Learning Free
    Exercise Free
  • 2. Simple Linear Regression
    50 min
    Join us to create your first simple regression in Excel and get familiar with a very important statistical concept – the Ordinary least squares framework. You will learn about OLS assumptions, how to interpret regression results, as well as how to decompose variability.
    50 min
    Join us to create your first simple regression in Excel and get familiar with a very important statistical concept – the Ordinary least squares framework. You will learn about OLS assumptions, how to interpret regression results, as well as how to decompose variability.
    Section 2: Learning Objectives
    Linear Regression: Introduction Free
    Linear Regression Free
    Exercise
    Linear Regression Model (Graphical Representation) Free
    Exercise
    Formatting Excel Spreadsheets Free
    First Regression in Excel Free
    What Is OLS? Free
    Interpreting Regression Tables (Part 1) Free
    Exercise
    Decomposition of Variability Free
    Interpreting Regression Tables (Part 2)
    Interpreting Regression Tables (Part 3)
    Exercise
  • 3. Multiple Linear Regression
    50 min
    In section 3 you will discover multiple linear regression. We will expand on the simple linear regression techniques we covered in the previous section and discuss some practical considerations such as working with dummy variables and how to make predictions with more than one independent variable using Excel.
    Section 3: Learning Objectives
    Multiple Regression Analysis
    Multiple Linear Regression (Example)
    Multiple Linear Regression (Results)
    Exercise
    OLS Assumptions
    OLS Assumptions: Linearity
    OLS Assumptions: No Endogeneity
    OLS Assumptions: Normality and Homoscedasticity
    OSL Assumptions: No Autocorrelation
    OLS Assumptions: No Multicollinearity
    Exercise
    Dummy Variables
    Dummy Variables - Exercise
    Making Predictions Using Linear Regression
    Making Predictions Using Linear Regression -Exercise
  • 4. Linear Regression Practical Example
    43 min
    An all-in-one use case that tests your understanding of each of the concepts you mastered so far. We will focus on a property price dataset and create a linear regression model to predict house prices.
    43 min
    An all-in-one use case that tests your understanding of each of the concepts you mastered so far. We will focus on a property price dataset and create a linear regression model to predict house prices.
    Section 4: Learning Objectives
    Practical Example (part 1)
    Practical Example (part 2)
    Practical Example (part 3)
    A note on multicollinearity
    Feature Scaling
    Practical Example (part 4)
    Practice exam
  • 5. Logistic Regression
    71 min
    This section of the course covers logistic regression. You will grasp the difference between logistic and logit regression, the concepts of ROC curve, underfitting and overfitting, and how to interpret results from a logistic regression. Of course, you will see a practical example of how to perform this type of regression in Excel and calculate the accuracy of your model.
    Section 5: Learning Objectives
    Introduction to Logistic Regression
    From Linear to Logistic Regression
    Logistic vs. Logit Function
    Applying Logistic Regression in Excel
    Interpreting Regression Coefficients
    Logistic Regression with Xreal
    Exercise
    Understanding the Logistic Regression Summary (part 1)
    Understanding the Logistic Regression Summary (Part 2)
    Exercise
    ROC Curve
    Binary Predictors for Logistic Regressions
    Underfitting and Overfitting
    Testing the Logistic Model
    Exercise
    Practice exam
  • 6. Cluster Analysis
    16 min
    Cluster analysis is the most intuitive and important example of unsupervised learning. However, to be able to understand cluster analysis, you must first become familiar with the mathematics behind it. Here we will explore the fundamentals of cluster analysis and have a look at the differences between clustering and classification.
    Section 6: Learning Objectives
    Cluster Analysis (Definition)
    Cluster Analysis (Application)
    Clustering vs Classification
    Cluster Analysis (Math Prerequisites)
    Exercise
  • 7. K-means Clustering
    59 min
    Master K-means clustering in Excel by learning how to choose the number of clusters in your analysis and determine when to standardize or not standardize your data. At the end of this section, we will go through a complete practical example that includes marketing segmentation with cluster analysis.
    Section 7: Learning Objectives
    K-means Clustering
    K-means Clustering in Excel
    K-means Clustering with Xreal
    Choosing the Number of Clusters
    Clustering Categorical Data
    Exercise
    Standardization
    Clustering and Regression
    Clustering (Pros and Cons)
    Types of Clustering
    Exercise
    Market Segmentation (Part 1)
    Market Segmentation (Part 2)
    Practice exam
  • 8. Decision Trees
    29 min
    With the use of visual examples this section of the course introduces you to the concept of decision trees. We will cover the advantages and disadvantages of this method and explore its inner workings – how is the tree constructed and what metrics are used in its construction. This will be followed up by a practical example showcasing how to create decision trees in Excel.
    Section 8: Learning Objectives
    Decision Trees
    Entropy (Loss function)
    Information Gain
    Decision Trees in Excel (Part 1)
    Decision Trees in Excel (part 2)
    Decision trees (Prediction)
    Exercise
    Practice exam
  • 9. Machine Learning in the Cloud
    31 min
    In the final section of the course, we will combine Azure and Microsoft Excel to run ML experiments in the cloud. In our case, we’ll create a predictive analytics model in Azure Machine Learning Studio.
    31 min
    In the final section of the course, we will combine Azure and Microsoft Excel to run ML experiments in the cloud. In our case, we’ll create a predictive analytics model in Azure Machine Learning Studio.
    Section 9: Learning Objectives
    Machine Learning in the Cloud
    Exercise
    Setting up Azure Machine Learning Studio (AMLS)
    First Experiment in AMLS (Part 1)
    First Experiment in AMLS (Part 2)
    Machine Learning in the Cloud (Assignment)
    Publishing a Web Service
    Exercise
    Azure Assignment
    The Future of Machine Learning
  • 10. Course project and exam
    340 min
    340 min
    Regression Analysis in Excel Project
    Course exam

Free lessons

Course Introduction

1.2 Course Introduction

5 min

What Is Machine Learning?

1.3 What Is Machine Learning?

8 min

Types of Machine Learning

1.4 Types of Machine Learning

5 min

Linear Regression: Introduction

2.2 Linear Regression: Introduction

2 min

Linear Regression

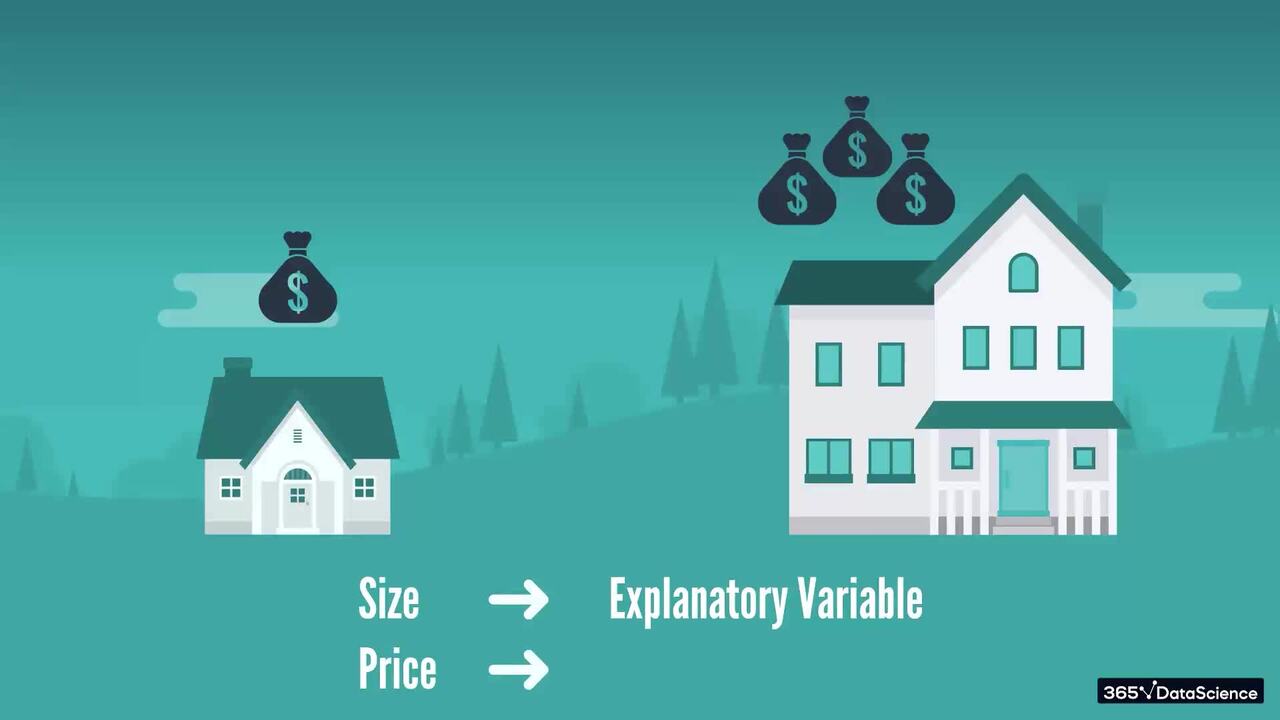
2.3 Linear Regression

5 min

Linear Regression Model (Graphical Representation)

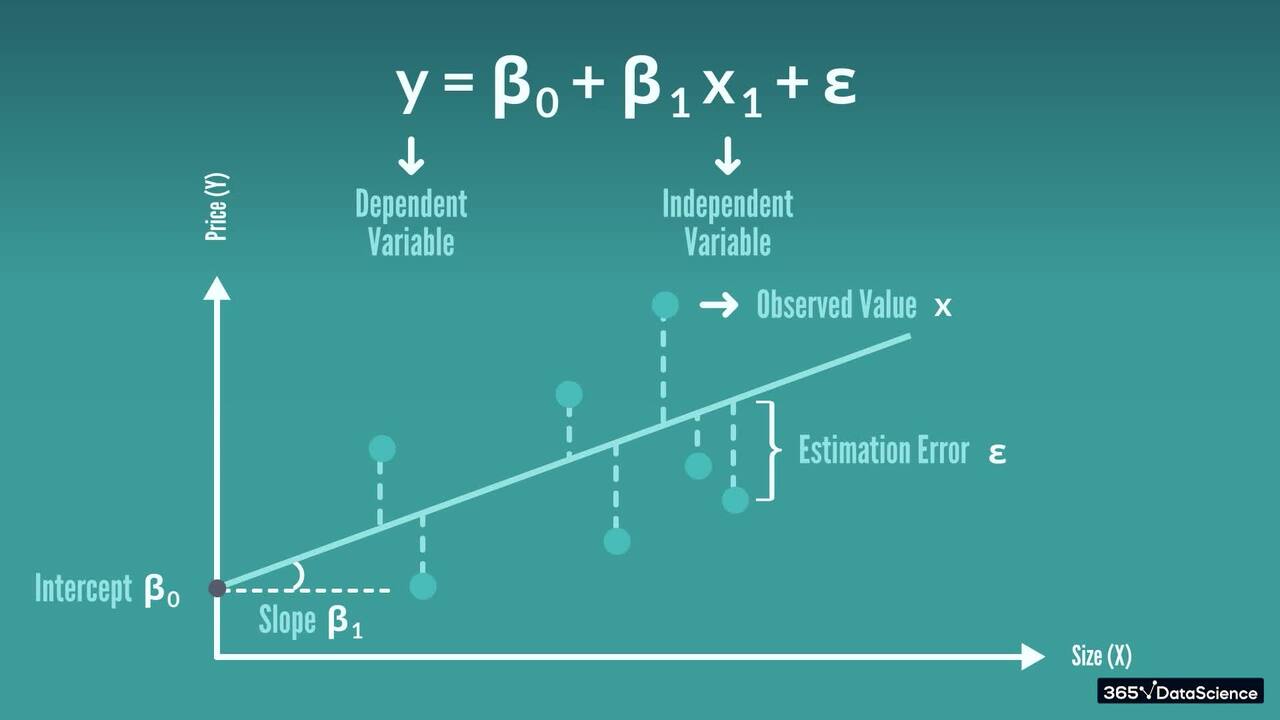
2.5 Linear Regression Model (Graphical Representation)

3 min

Start for free

ACCREDITED certificates

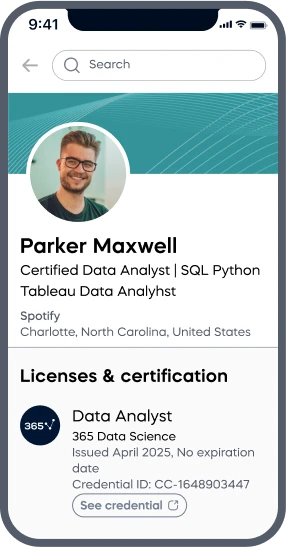
Craft a resume and LinkedIn profile you’re proud of—featuring certificates recognized by leading global institutions.

Earn CPE-accredited credentials that showcase your dedication, growth, and essential skills—the qualities employers value most.

  • Institute of Analytics
  • The Association of Data Scientists
  • E-Learning Quality Network
  • European Agency for Higher Education and Accreditation
  • Global Association of Online Trainers and Examiners

Certificates are included with the Self-study learning plan.

A LinkedIn profile mockup on a mobile screen showing Parker Maxwell, a Certified Data Analyst, with credentials from 365 Data Science listed under Licenses & Certification. A 365 Data Science Certificate of Achievement awarded to Parker Maxwell for completing the Data Analyst career track, featuring accreditation badges and a gold “Verified Certificate” seal.

How it WORKS

  • Lessons
  • Exercises
  • Projects
  • Practice exams
  • AI mock interviews

Lessons

Learn through short, simple lessons—no prior experience in AI or data science needed.

Try for free

Exercises

Reinforce your learning with mini recaps, hands-on coding, flashcards, fill-in-the-blank activities, and other engaging exercises.

Try for free

Projects

Tackle real-world AI and data science projects—just like those faced by industry professionals every day.

Try for free

Practice exams

Track your progress and solidify your knowledge with regular practice exams.

Try for free

AI mock interviews

Prep for interviews with real-world tasks, popular questions, and real-time feedback.

Try for free

Student REVIEWS

A collage of student testimonials from 365 Data Science learners, featuring profile photos, names, job titles, and quotes or video play icons, showcasing diverse backgrounds and successful career transitions into AI and data science roles.