Data Literacy
Explore the Flashcards:
The ability to read, understand, create, and communicate data as information.
Data Literate Person
A data-literate person can articulate a problem that can potentially be solved using data.
Confirmation bias
The tendency to search for, interpret, favor
and recall information that supports your views while dismissing non-supportive data.
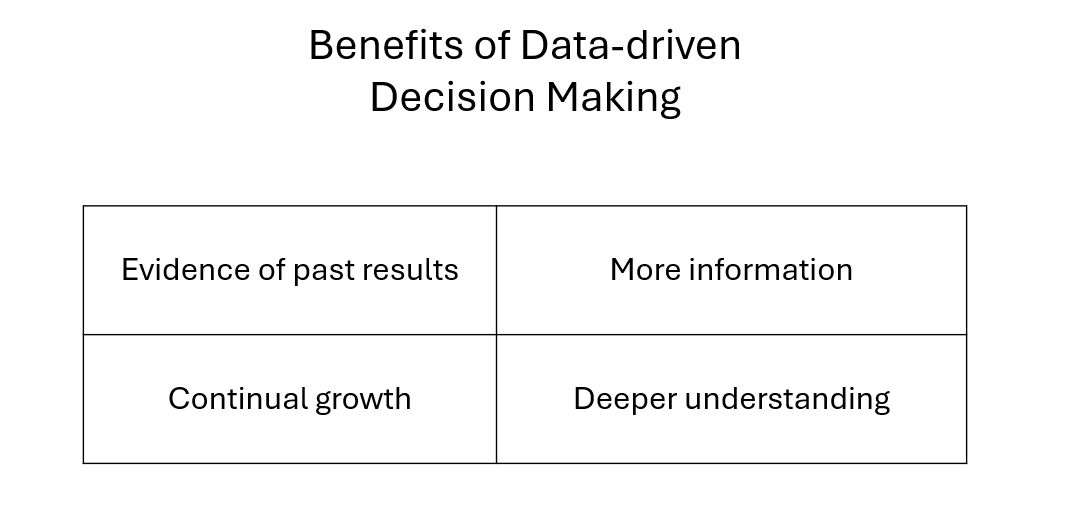
Data-driven Decision Making
The process of making organizational decisions based on actual data rather than intuition or observation alone.
This approach aims to make the decision-making process more objective and fact-based.
Automated Manufacturing
A method of manufacturing that uses automation to control production processes and equipment with minimal human intervention.
It enhances efficiency, consistency, and quality in the production process.
Data
Factual information (such as measurements or statistics) used as a bias for reasoning, discussion, or calculation.
Datum
A single value of a single variable.
Quantitative Data
Information collection in a numerical form.
Discrete Data
A type of quantitative data that can only take certain values (counts).
Continuous Data
A type of quantitative data that can take any value.
Interval Data
A type of quantitative data measured along a scale with no absolute zero.
Ratio Data
A type of quantitative data measured along a scale with an equal ration and an absolute zero.
Qualitative Data
Information collection in a non-numerical form (descriptive).
Nominal Data
A type of qualitative data that don't have a natural order or ranking.
Ordinal Data
A type of qualitative data that have ordered categories.
Dichotomous Data
A type of qualitative data with binary categories. Dichotomous Data can only take two values.
Structured Data
Data that can conform to a predefined data model.
Semi-structured Data
Data that do not conform to a tabular data model, yet they have some structure.
Unstructured Data
Data that are not organized in a predefined manner.
Metadata
Data about the data.
Data at Rest
Data that are stored physically on a computer data storage like
cloud servers, laptops, hard drives, USB sticks, etc.
Data in Motion
Data that are flowing through a network of two or more systems.
Transactional Data
Data recorded from transactions.
Master Data
Data that describe core entities around which a business is conducted.
Although master data pertain to transactions, they are not transactional in nature.
Big Data
Data that are too large or too complex to be handled by data-processing techniques and software.
Usually described by their volume, variety, velocity, and veracity.
Volume
A characteristic of big data referring to the vast amount of data generated every second.
RAM (Random Access Memory)
A type of computer memory that can be accessed randomly. Determines how much memory the operating system and open applications can use.
RAM is volatile and temporary.
Variety
The multiplicity of types, formats, and sources of data available.
ERP (Enterprise Resource Planning)
A type of software that organizations use to manage and integrate the important parts of their businesses.
An ERP software system can integrate planning, purchasing inventory, sales, marketing, finance, human resources, and more.
SCM (Supply Chain Management)
The management of the flow of goods and services, involving the movement and storage of raw materials, work-in-process inventory,
and of finished goods from the point of origin to the point of consumption.
CRM(Customer Relationship Management)
A technology for managing all your company's relationships and interactions with customers and potential customers.
It helps improve business relationships to grow your business.
Velocity
The frequency of incoming data.
Veracity
The accuracy or truthfulness of a data set.
Data Security Management
The process of implementing controls and safeguards to protect data from unauthorized access, use, disclosure, disruption, modification,
or destruction to ensure confidentiality, integrity, and availability.
Master Data Management
A method of managing the organization's critical data. It provides a unified master data service that provides accurate, consistent,
and complete master data across the enterprise and to business partners.
Data Quality Management
The process of ensuring the accuracy, completeness, reliability, and relevance of data. It involves the establishment of processes, roles, policies,
and metrics to ensure the high quality of data.
Metadata Management
The administration of data that describes other data.
It provides information about a data item's content, context, and structure, essential for resource management and discovery.
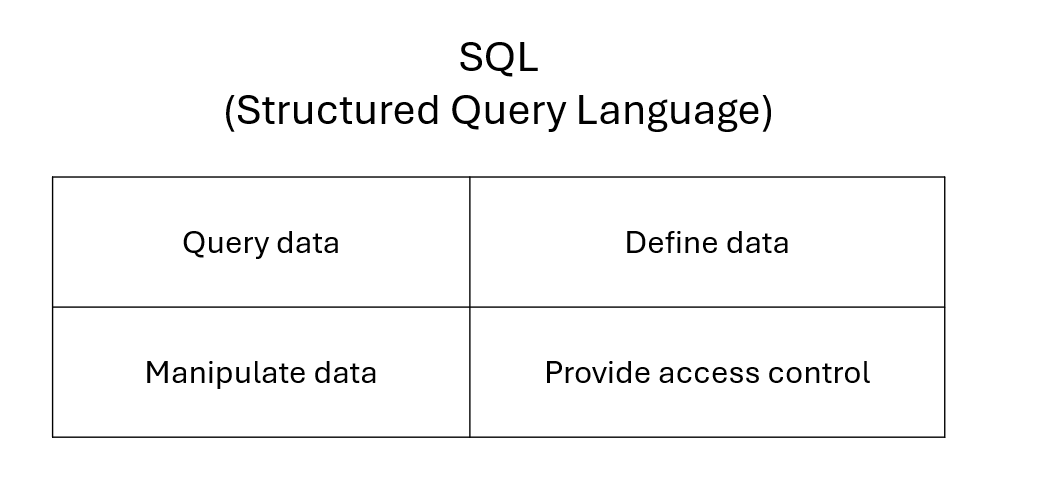
Database
A systematic collection of data.
Data Model
Shows the interrelationships and data flow between different tables.
Relational Databases
Databases that use a relational model. They are very efficient and flexible when accessing structured information.
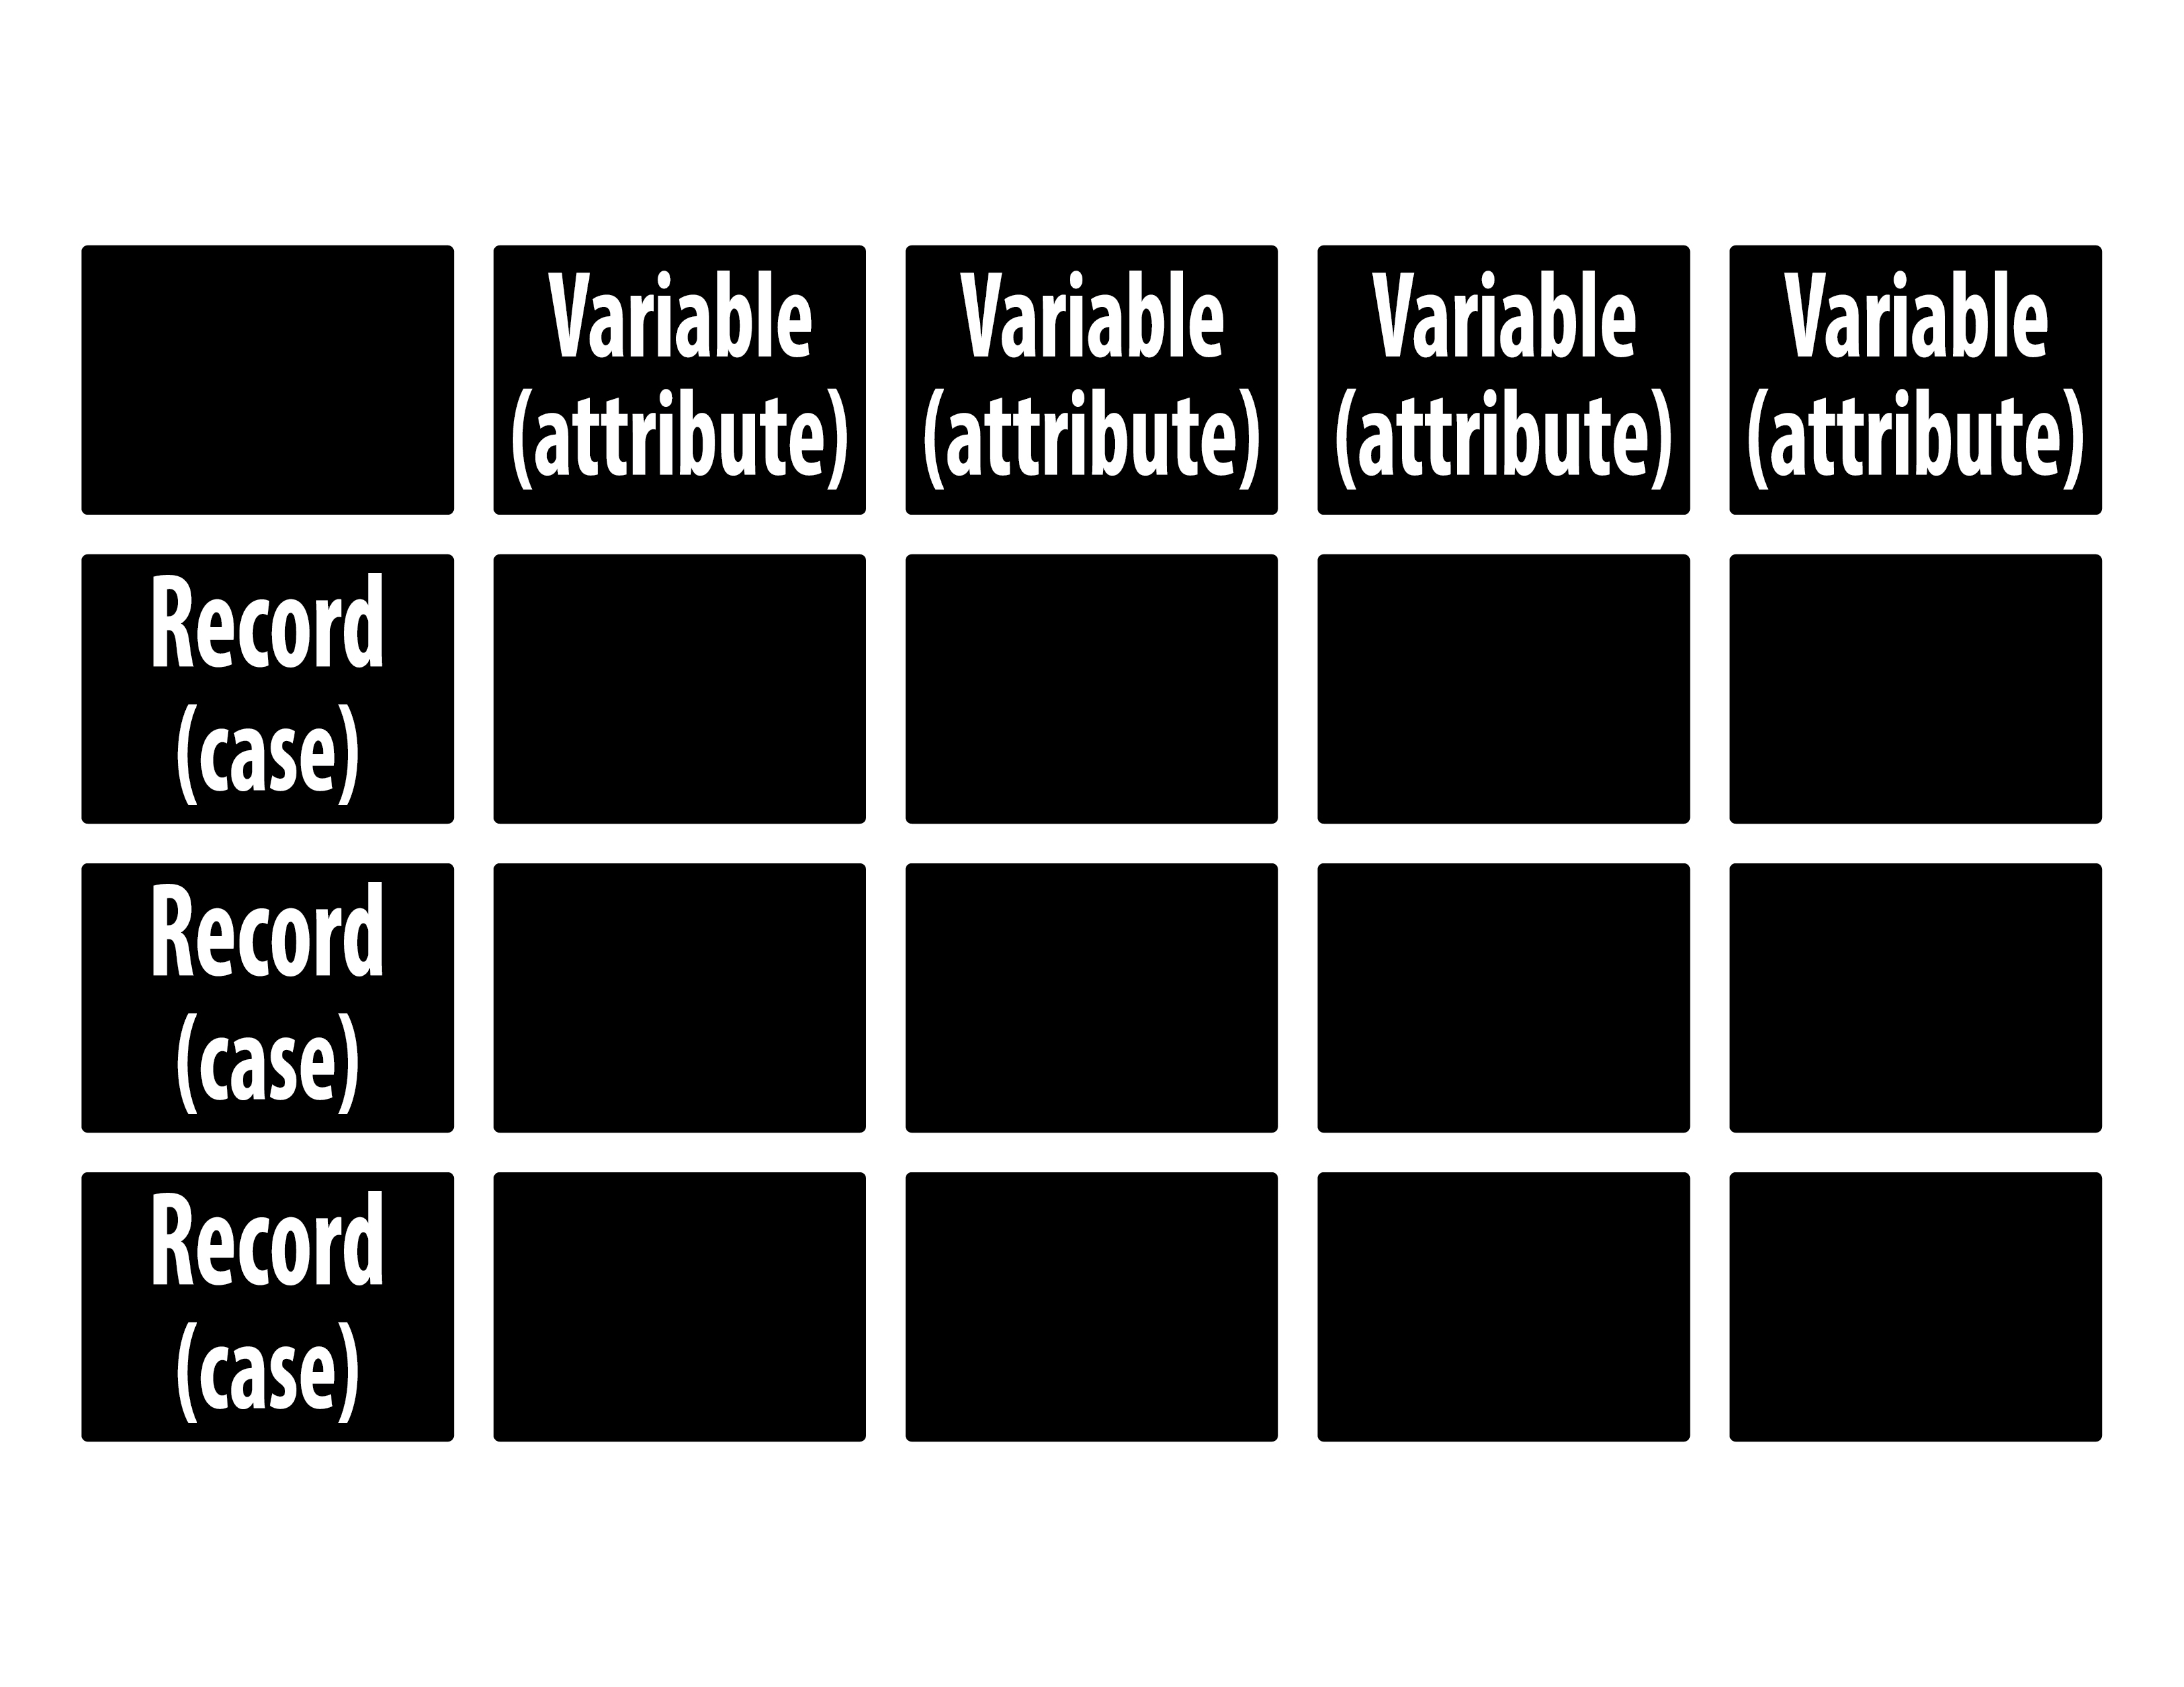
SQL (Structured Query Language)
A standard programming language used in managing and manipulating relational databases.
It allows users to query, update, insert, and modify data, as well as manage database structures.
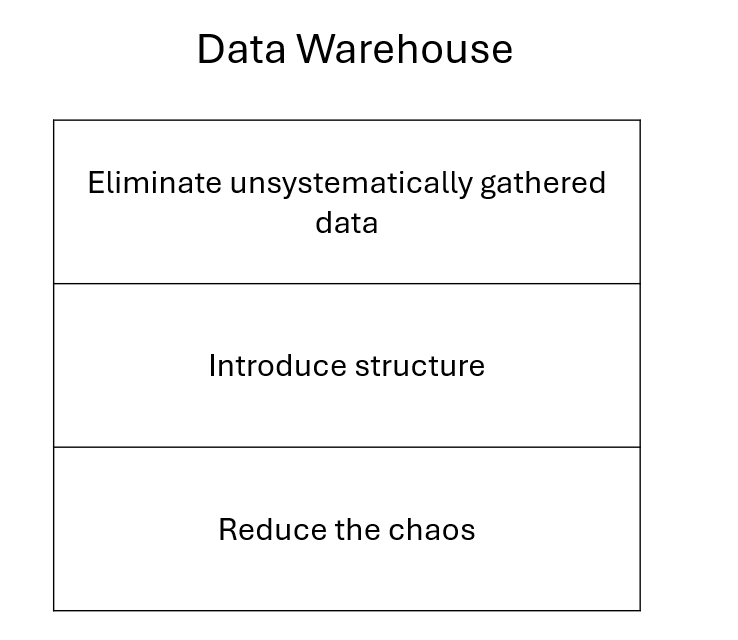
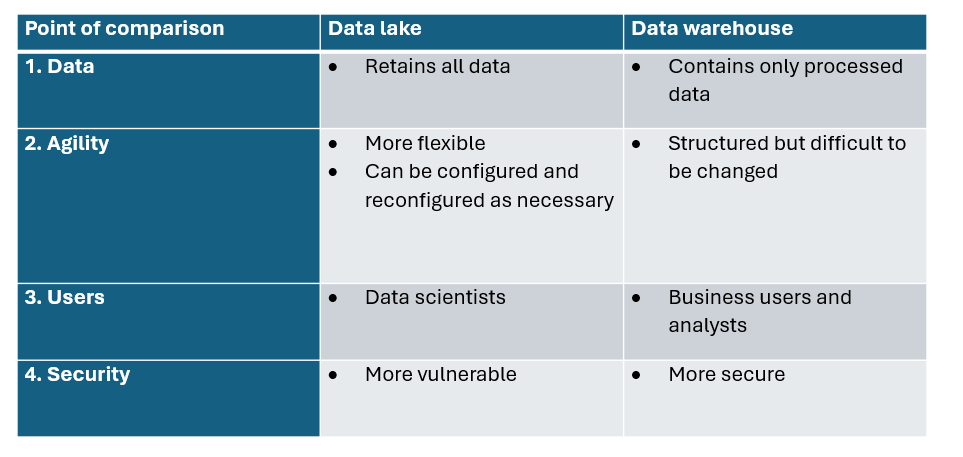
Data Warehouse
A single centralized repository that integrates data from various sources and is designed to facilitate analytical reporting for workers throughout the enterprise.
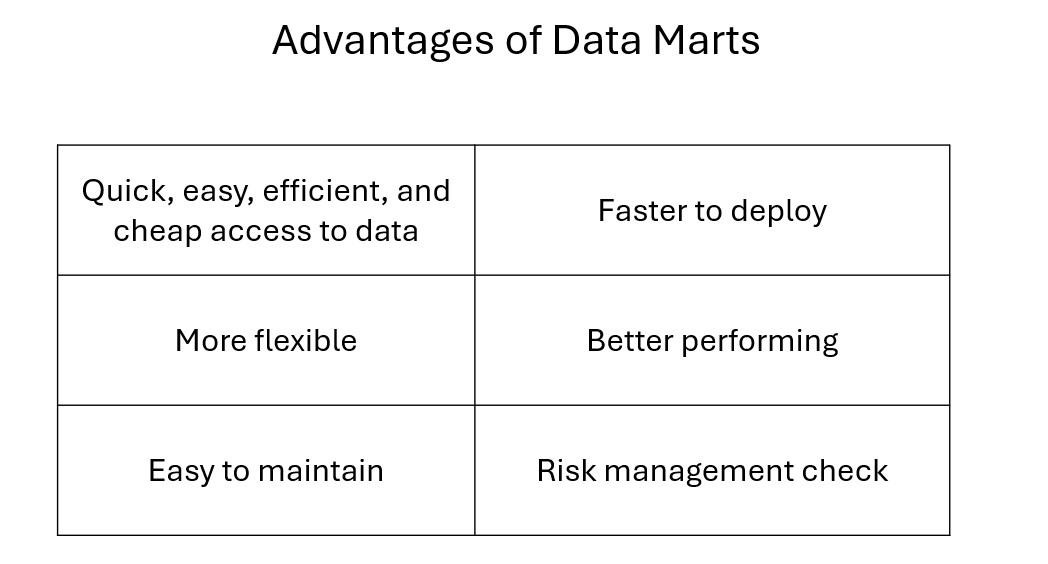
Data Mart
A subset of a data warehouse, focusing on a single functional area, line of business,
or department of an organization.
ETL
Extract. Transform. Load.
Hadoop
A set of software utilities designed to enable the use of a network of computers to solve Big data problems.
Hadoop Distributed File System (HDFS)
A distributed file system designed to run on commodity hardware. It provides high throughput access to application data and is suitable for applications with large data sets.
Large Hadron Collider (LHC)
The world's largest and most powerful particle collider, located at CERN. It's used by physicists to study the smallest known particles and to probe the fundamental forces of nature.
Data Lake
A single repository of data stored in their native format.
They constitute a comparatively cost-effective solution for storing large amount of data.
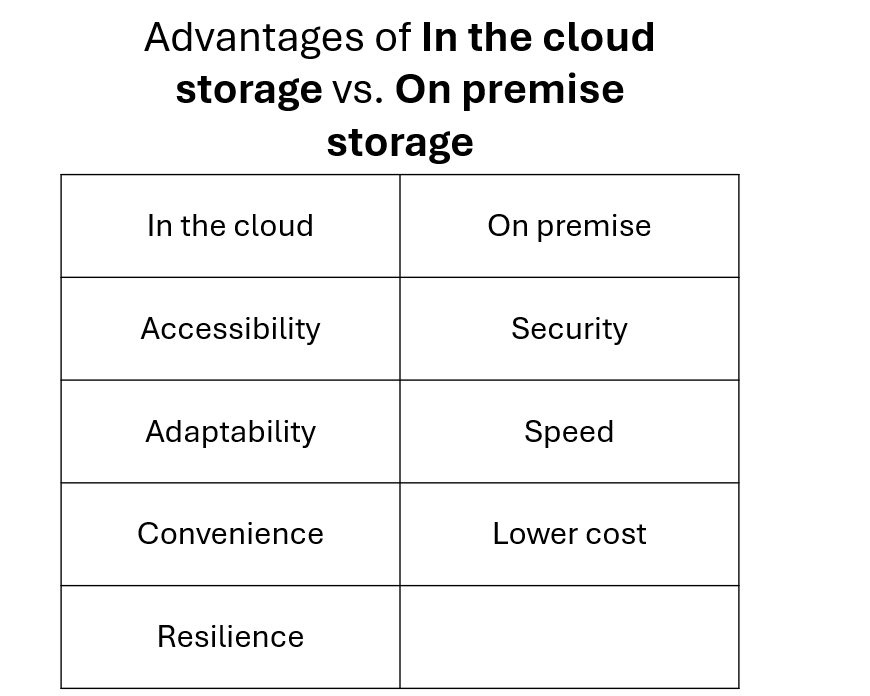
Cloud Systems
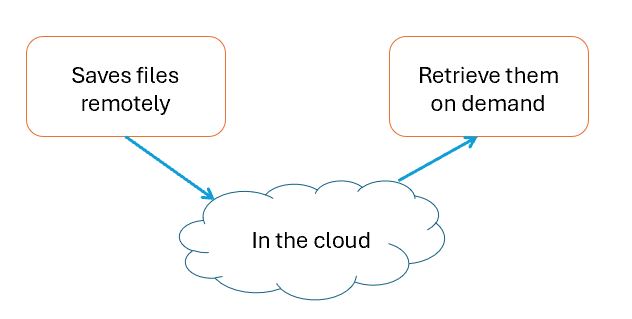
Cloud systems store data and applications on remote servers, enabling users to access them from any internet-connected device without installation.
Cyber Defense Center (CDC)
A centralized unit that deals with advanced security threats and manages the organization's cyber defense technology, processes, and people.
Batch
A block of data points collected within a given period (like a day, a week, or a month).
Batch Processing
Data are processed in large volumes all at once.
Stream Processing
Stream processing can also support non-stop data flows, enabling instantaneous reactions.
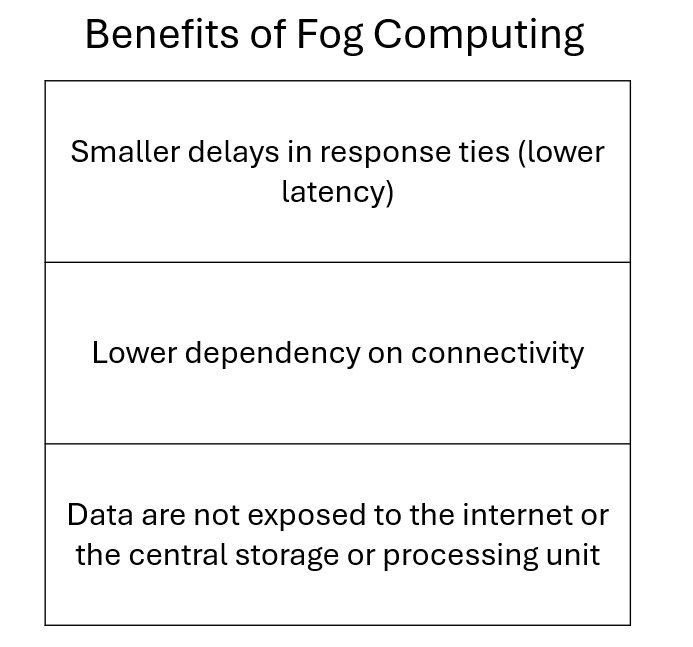
Fog/ Edge Computing
The computing structure is not located in the cloud, but rather at the devices that produce and act on data.
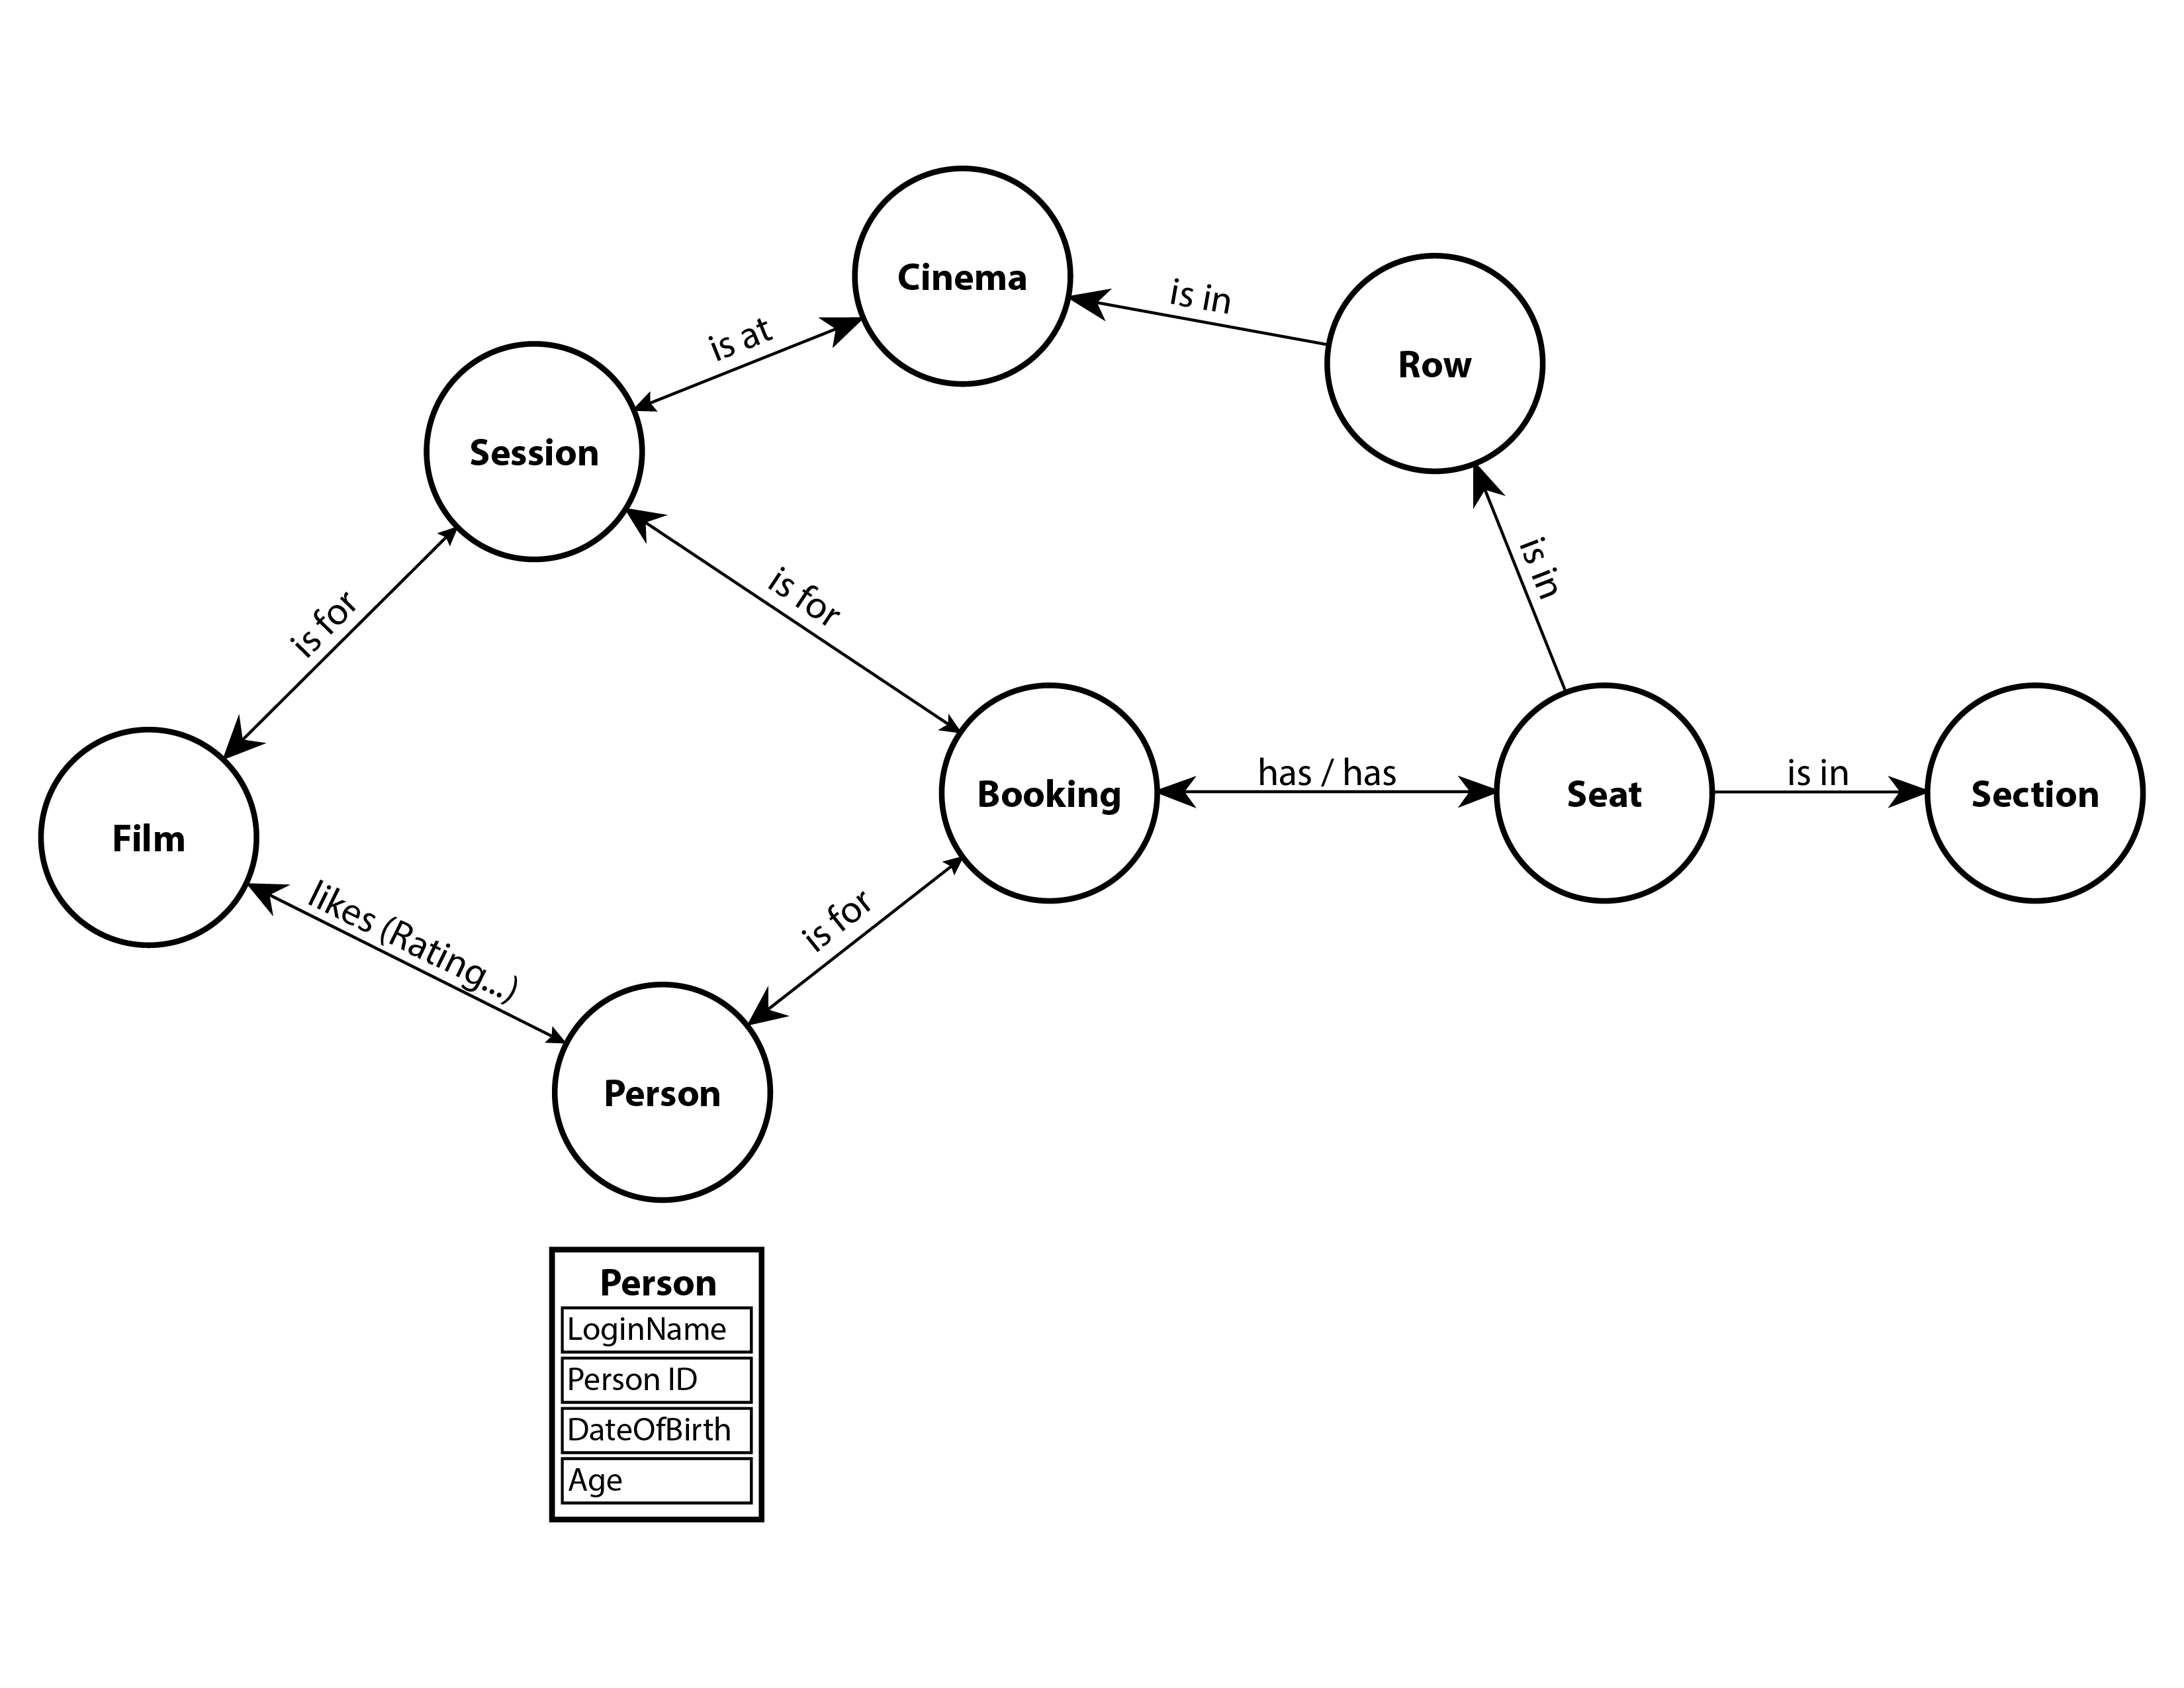
Graph Database
Stores connections alongside the data in the model.
Graphs
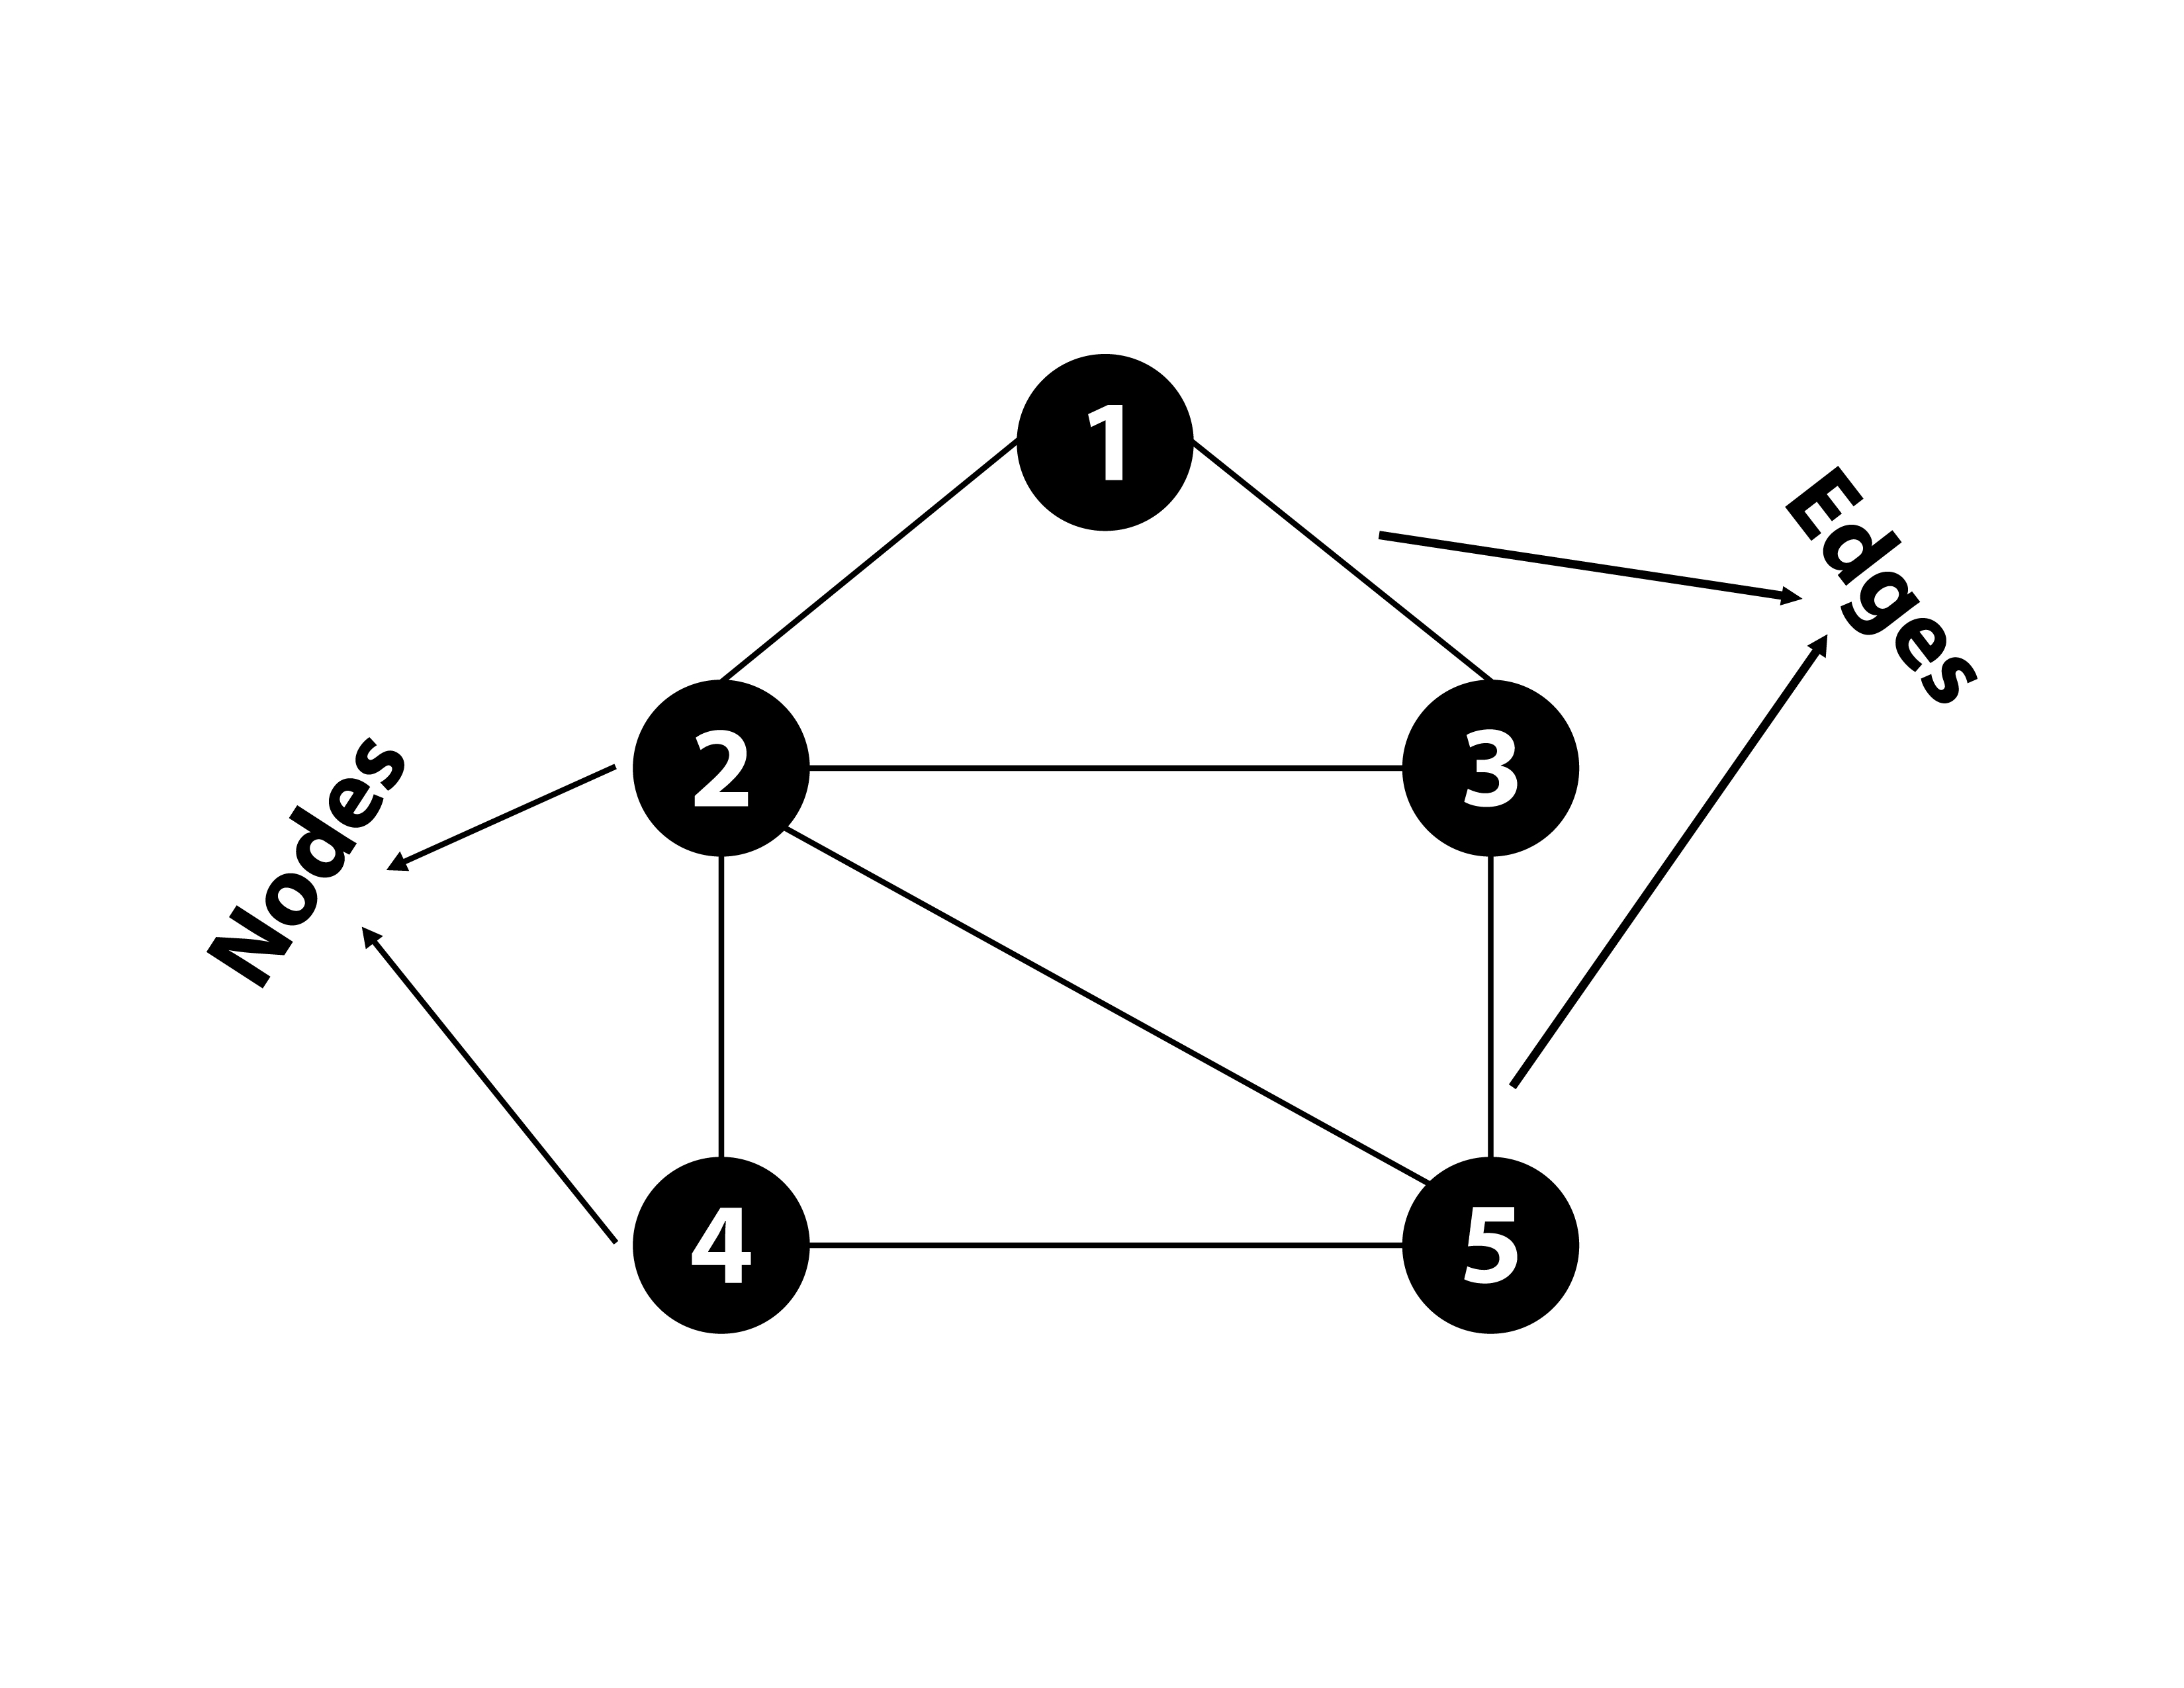
The network of connections that are stored, processed, modified, and queried.
Notably used for social networks, as they allow for much faster and high-performing queries than traditional databases.
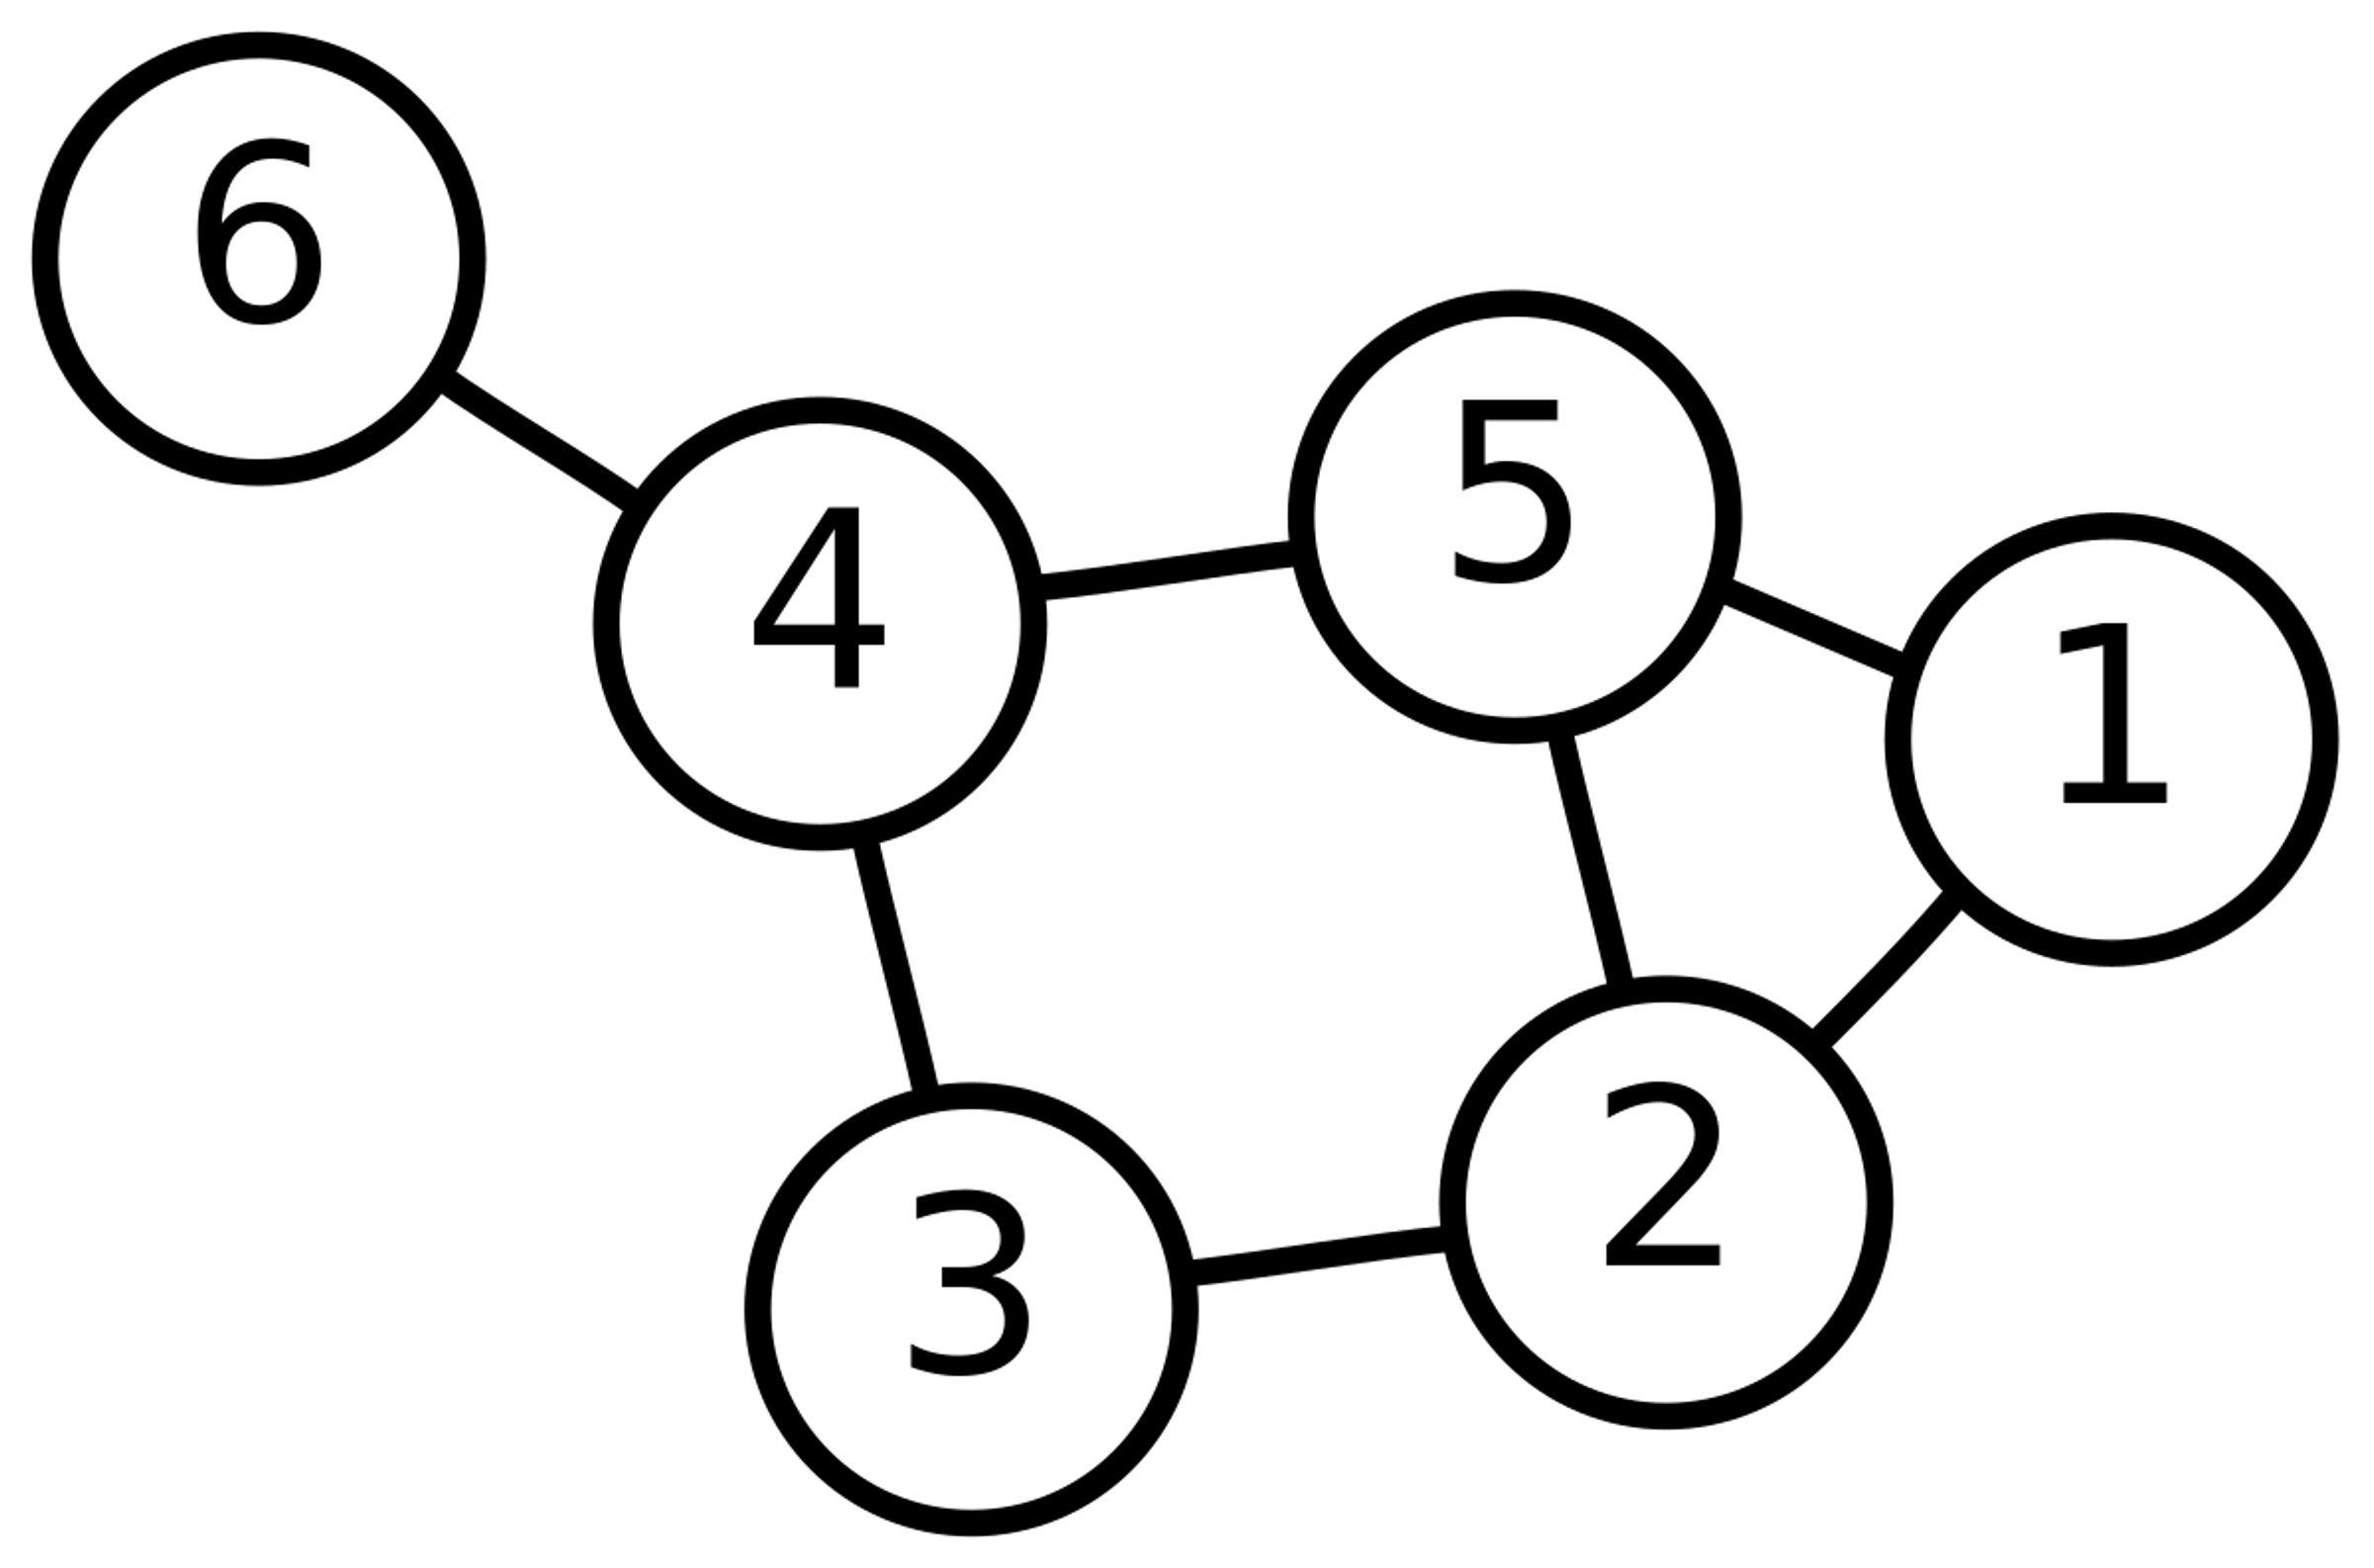
Edges
Describe the relationships between entities.
Recommendation Engines
Systems that predict and present items or content that a user may prefer based on their past behaviour, preferences, or interaction with the system.
Fraud Detection
The process of identifying and preventing fraudulent activities.
It involves the use of analytics, machine learning, and other techniques to detect and prevent unauthorized financial activities or transactions.
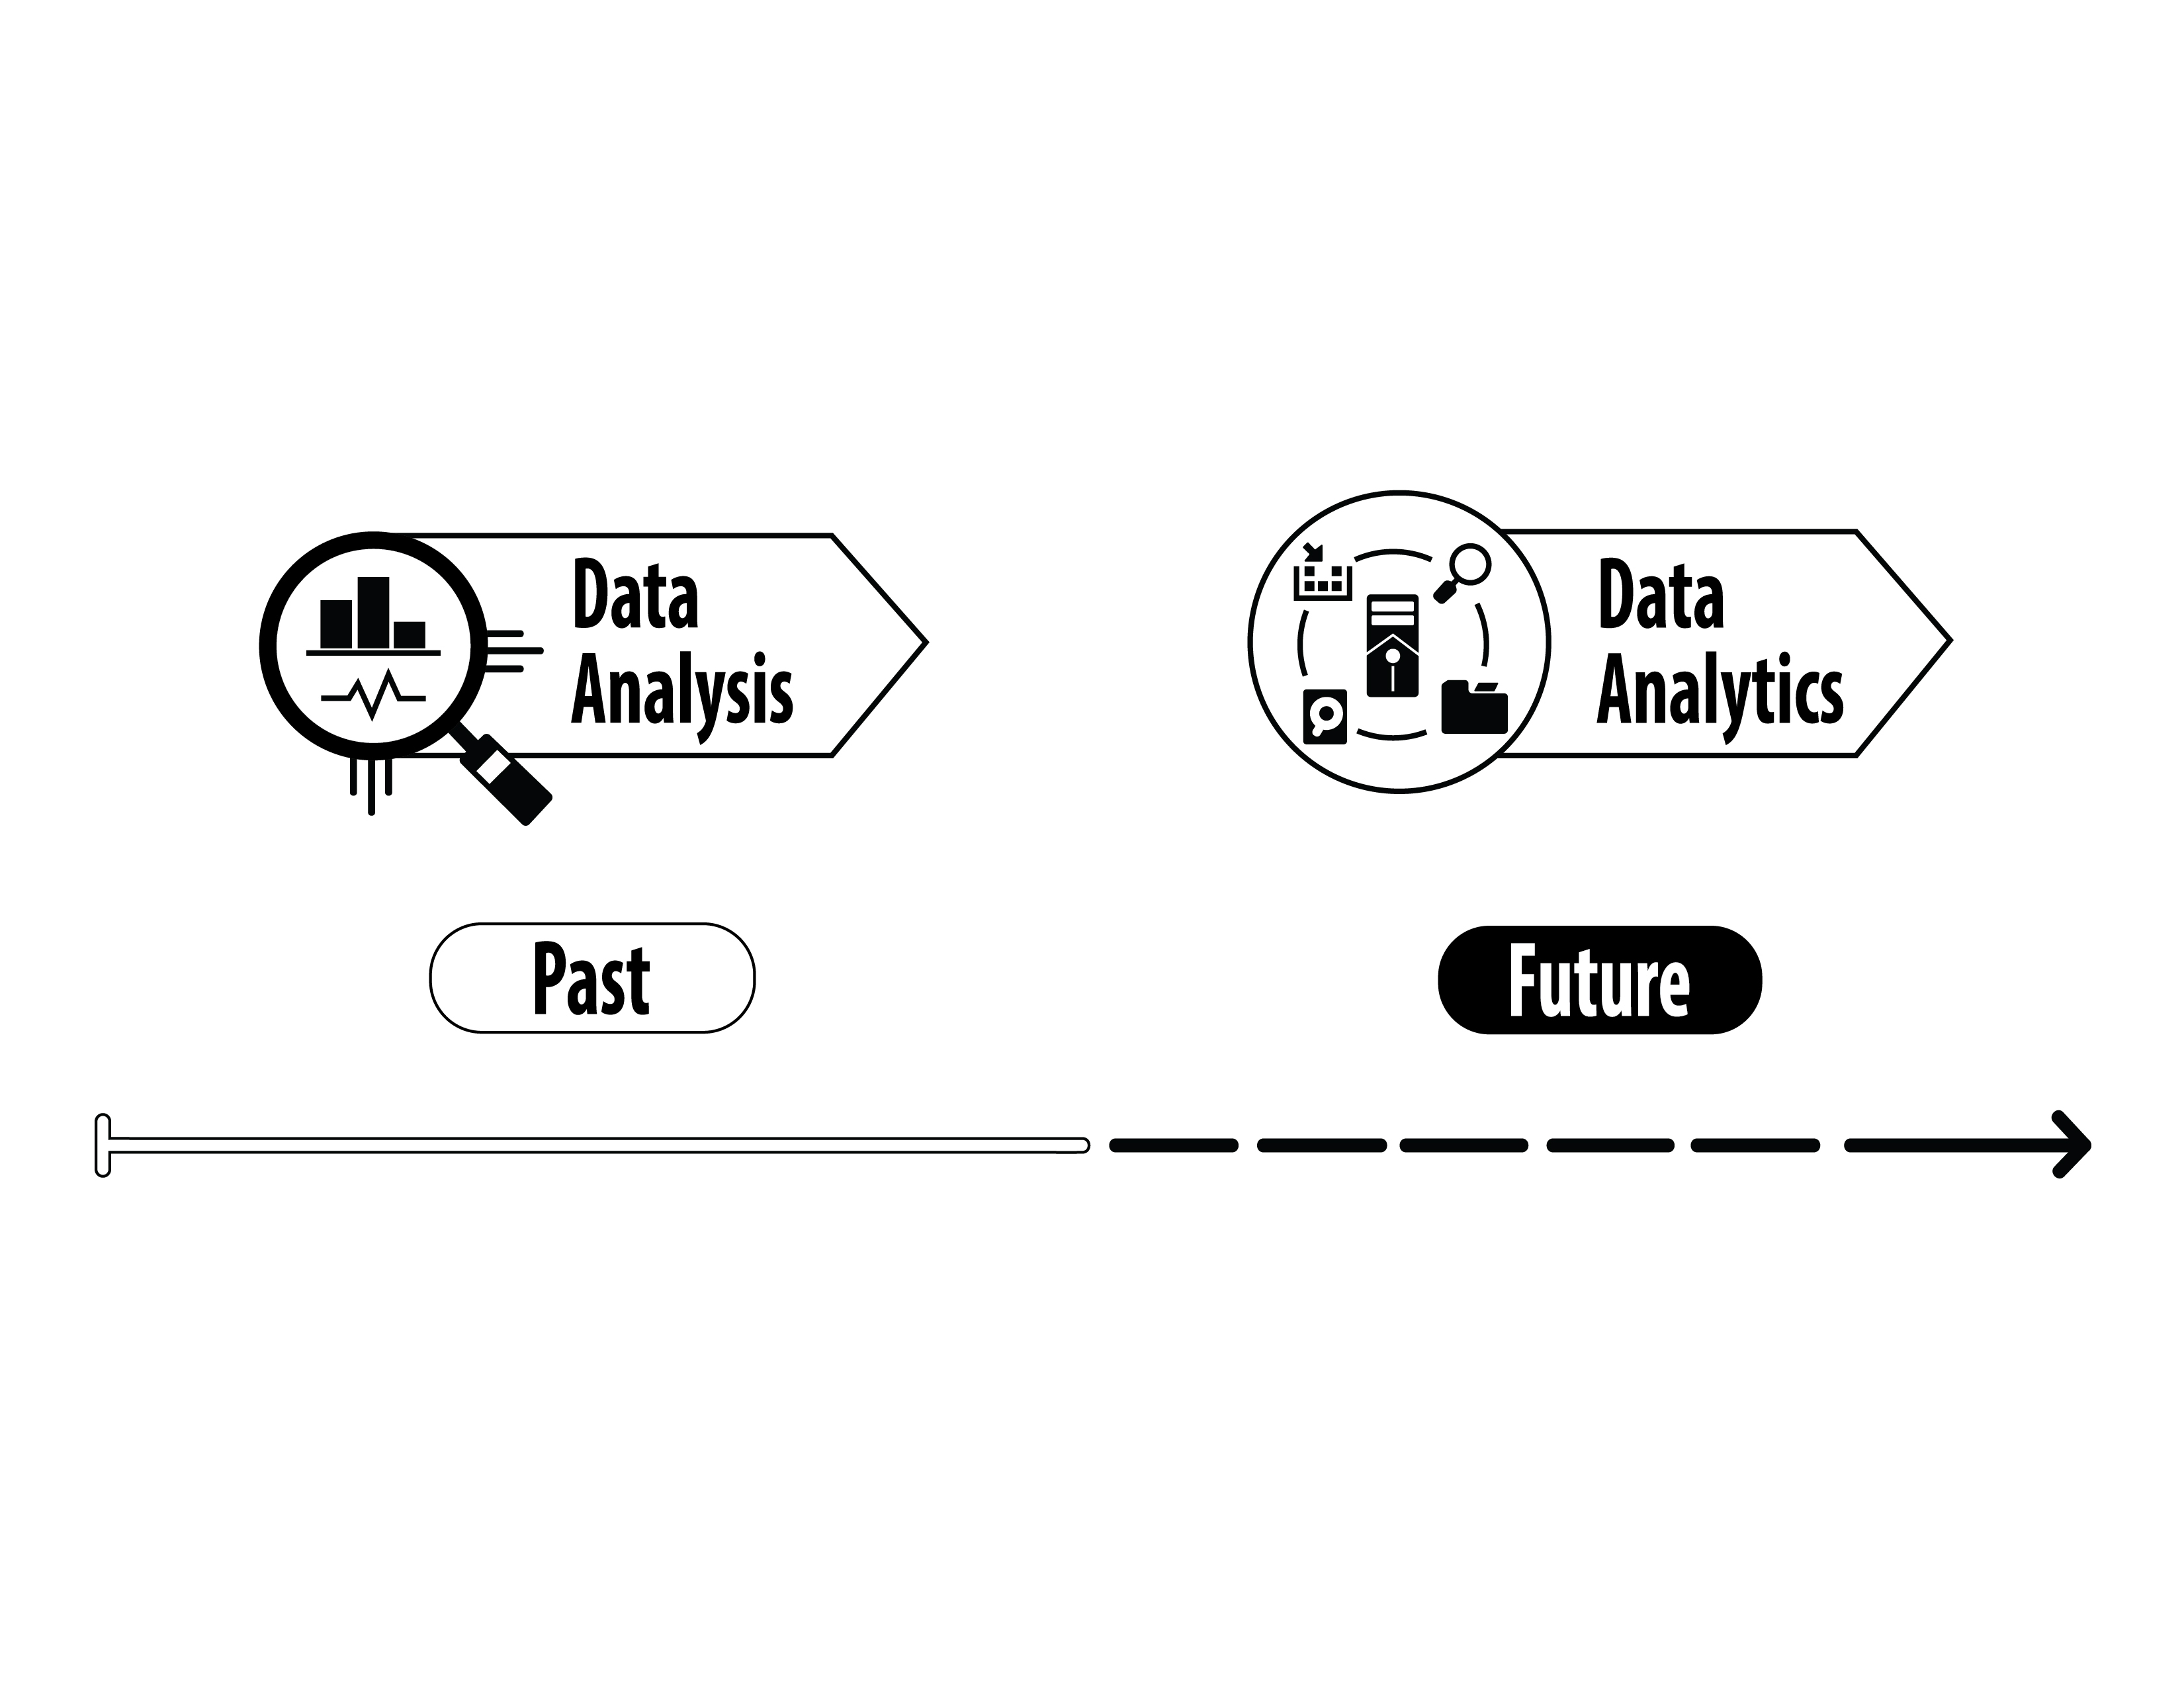
Analysis
A detailed examination of anything complex in order to understand its nature or
to determine its essential features.
Data Analysis
The in-depth study of all the components in a given data set.
Data Analytics
The examination, collection, organization, and storage of data.
Data Analytics implies a more systematic and scientific approach to working with data.
Data Acquisition
The process of collecting, measuring, and analyzing real-world physical or electrical data from various sources.
Often involves instrumentation and control systems, sensors, and data acquisition software.
Data Filtering
The technique of refining data sets by applying criteria or algorithms to remove unwanted or irrelevant data.
This process helps in enhancing the quality and accuracy of data for analysis.
Data Extraction
The process of retrieving data from various sources, which may include databases, websites, or other repositories.
The extracted data can then be processed, transformed, and stored for further use.
Data Aggregation
The process of gathering and summarizing information from different sources, typically for the purposes of analysis or reporting.
It often involves combining numerical data or categorical information to provide a more comprehensive view.
Data Validation
The practice of checking data against a set of rules or constraints to ensure it is accurate, complete, and reliable.
It is a critical step in data processing and analysis to ensure the integrity of the data.
Data Cleansing
The process of detecting, correcting, or removing corrupt or inaccurate records from a dataset, table, or database.
Data Visualization
The graphical representation of information and data.
By using visual elements like charts, graphs, and maps, data visualization tools provide an accessible way to see and understand trends, outliers, and patterns in data.
Statistics
The science of collecting, analyzing, presenting, and interpreting data.
It involves applying various mathematical and computational techniques to help make decisions in the presence of uncertainty.
Population
The entire pool from which a statistical sample is drawn.
Sample
A subset of a population that is statistically analyzed to estimate the characteristics of the entire population.
Sample size
The count of individual observations
Descriptive Statistics
Summarizing or describing a collection of data. Pic of questions
Measures of Central Tendency
Focus on the average (middle) values of the data set.
Mean
The average of a set of numbers. It is a non-robust measure of central tendency.
The mean is very susceptible to outliers.

What is the median of the data set: 1, 2, 2, 3, 4, 5, 6, 7, 9, 16?
5.5
Median
The middle value in a data set. The median is not affected by extreme values or outliers.
It is a robust measure of central tendency.
What is the median of the data set: 0, 1, 2, 2, 3, 4, 5, 6, 7, 9, 16?
4
What is the median of the data set: 1, 2, 2, 3, 4, 5, 6, 7, 9, 16?
4.5
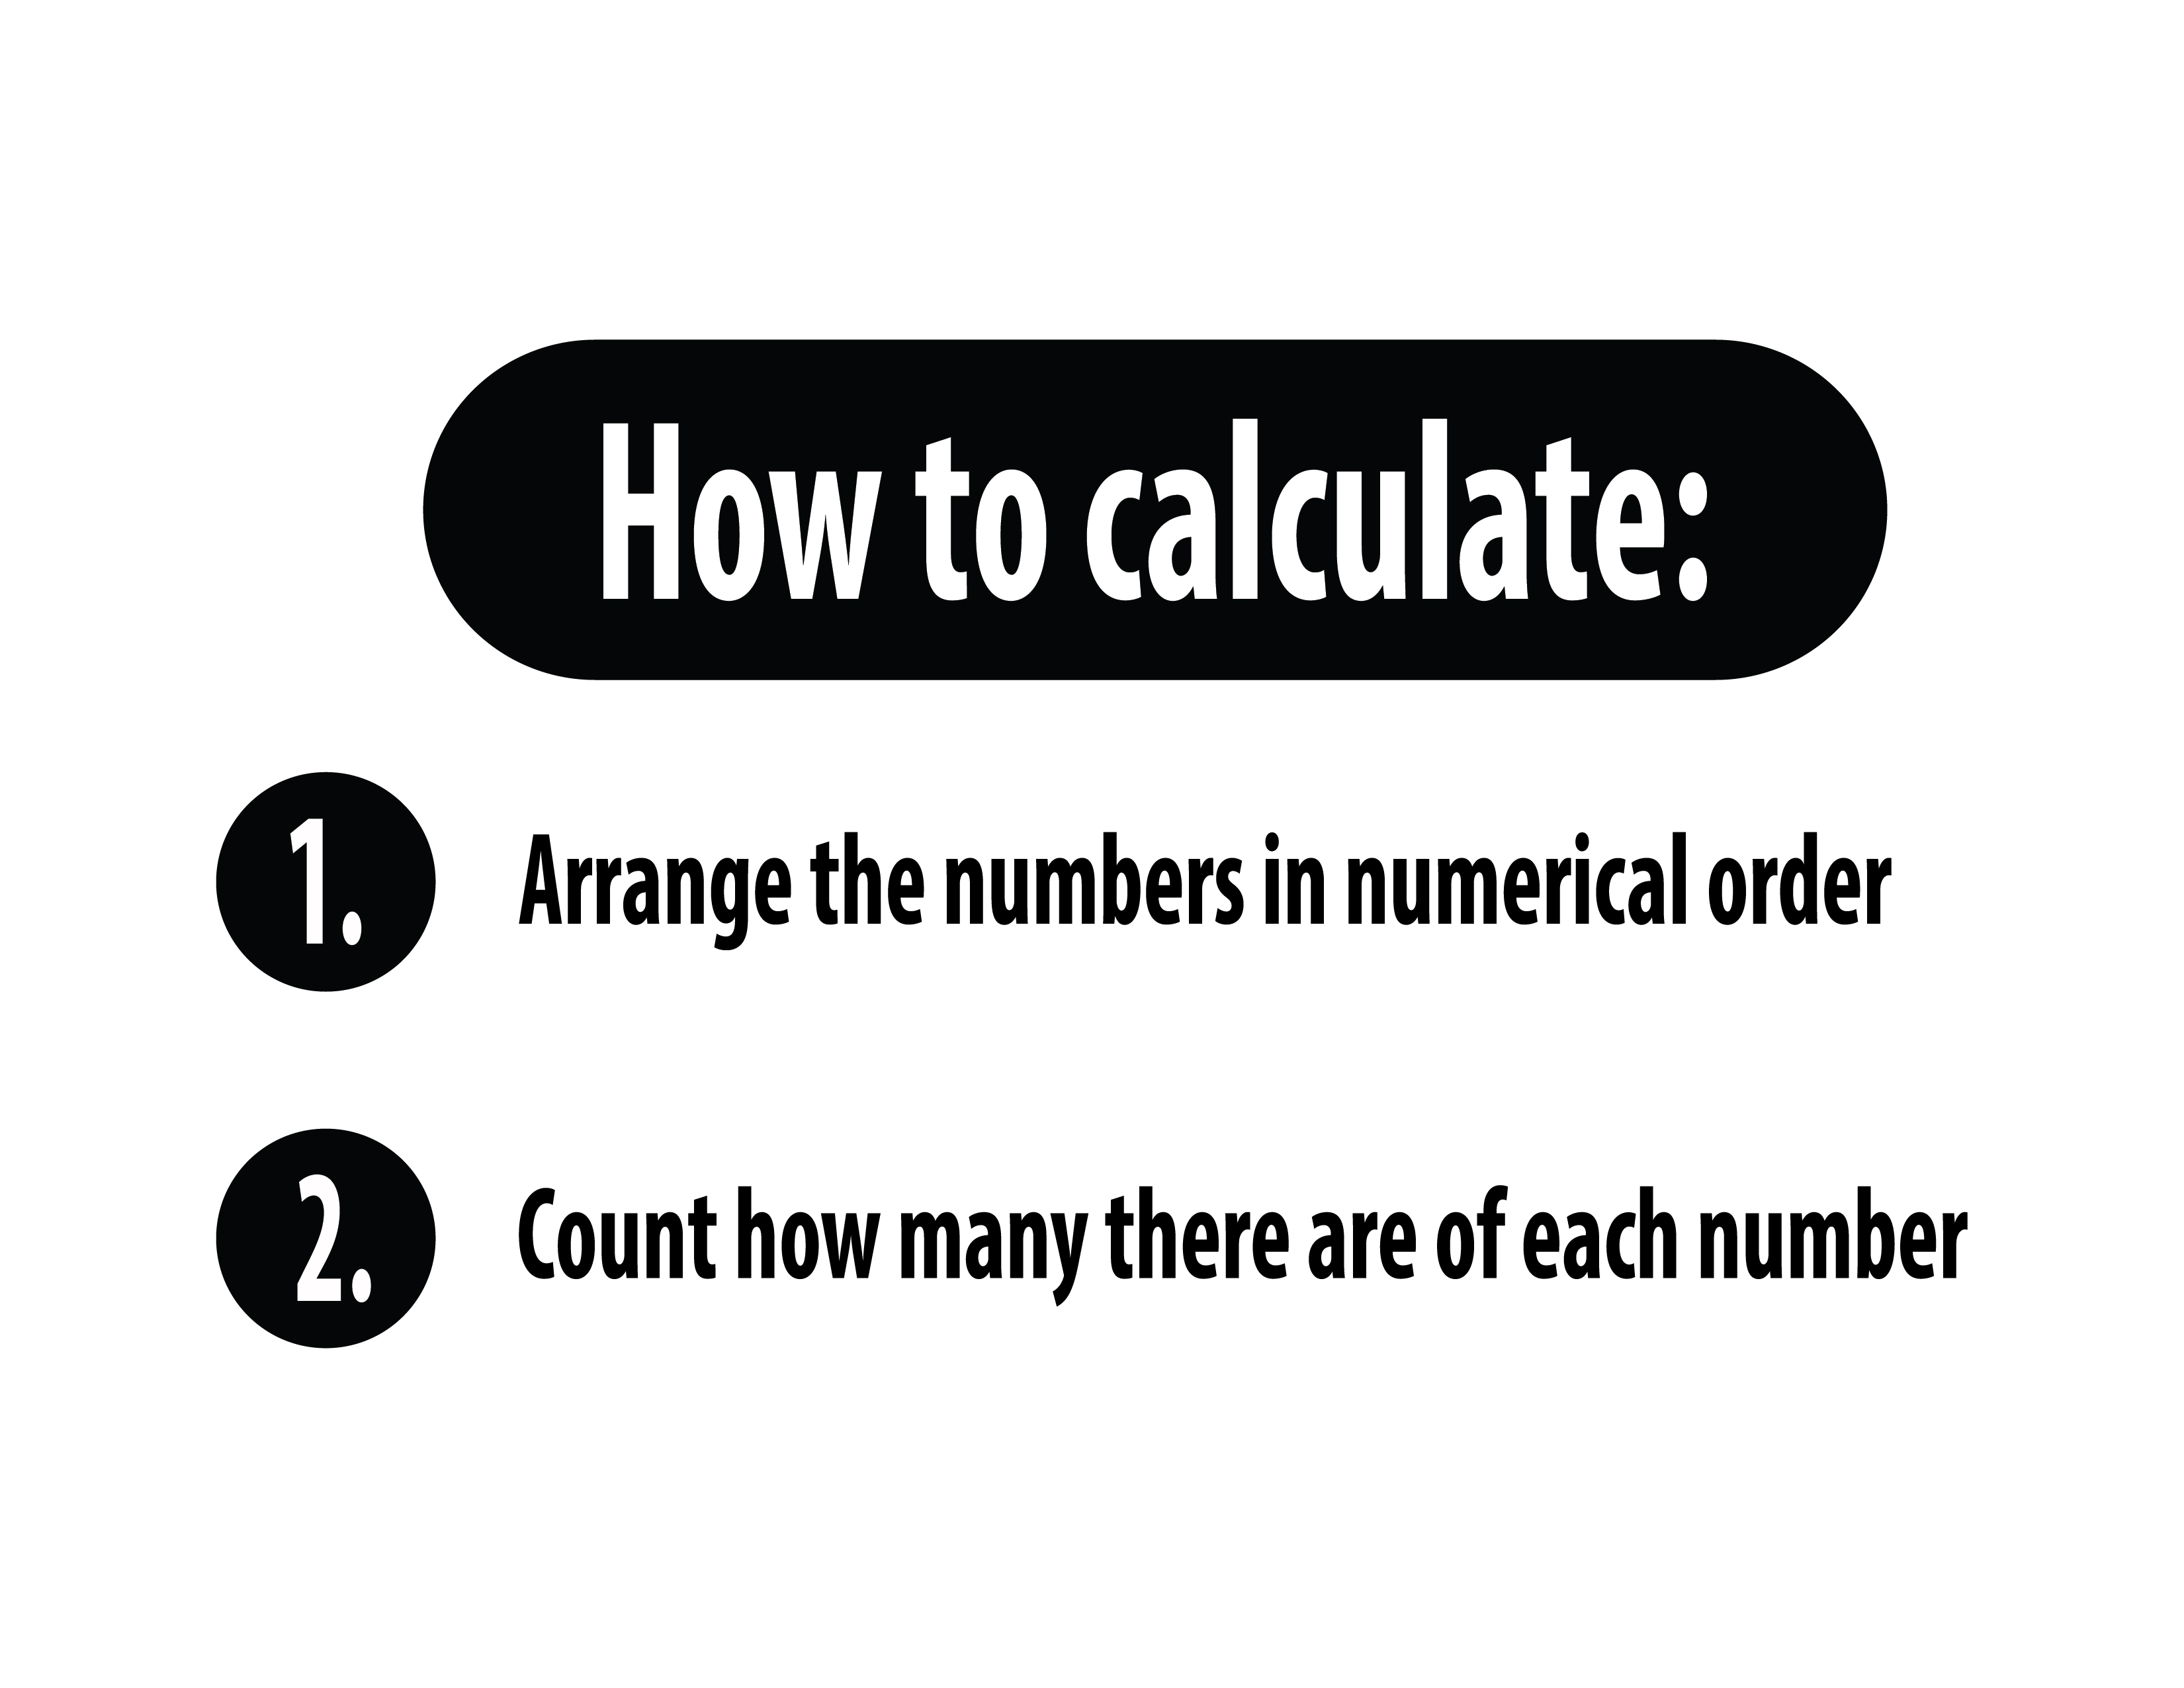
Mode
The most commonly observed value in a data set. A data set can have one, several or no modes.
What is the mode of the data set: 0, 1, 2, 2, 4, 4, 5, 6, 7, 9, 16?
2 and 4
Measures of Spread
Describe the dispersion of data within the data set.
Minimum and maximum
The lowest and highest values of the data set.
What is the minimum and maximum of the data set: 0, 1, 2, 2, 3, 4, 5, 6, 7, 9, 16
0 and 16
Range
The difference between the maximum and minimum values in a data set.
What is the range of the data set: 0, 1, 2, 2, 3, 4, 5, 6, 7, 9, 16
16
Variance
How far each value lies from the mean.
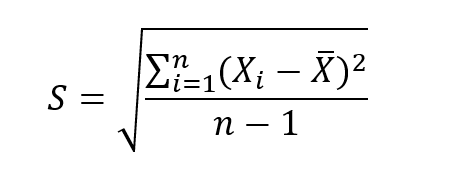
What is the variance of the data set: 0, 1, 2, 2, 3, 4, 5, 6, 7, 9, 16
18.73
Standard Deviation
Measures the dispersion of a data set relative to its mean. It is expressed in the same unit as the data.
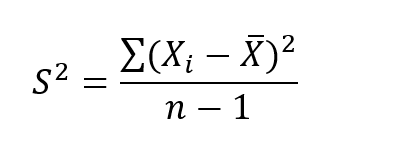
What is the standard deviation of the data set: 0, 1, 2, 2, 3, 4, 5, 6, 7, 9, 16
4.32
Correlation
Indicates the direction and the strength of the linear relationship between two variables.
Correlation analysis is only applicable to quantitative (numerical) values.
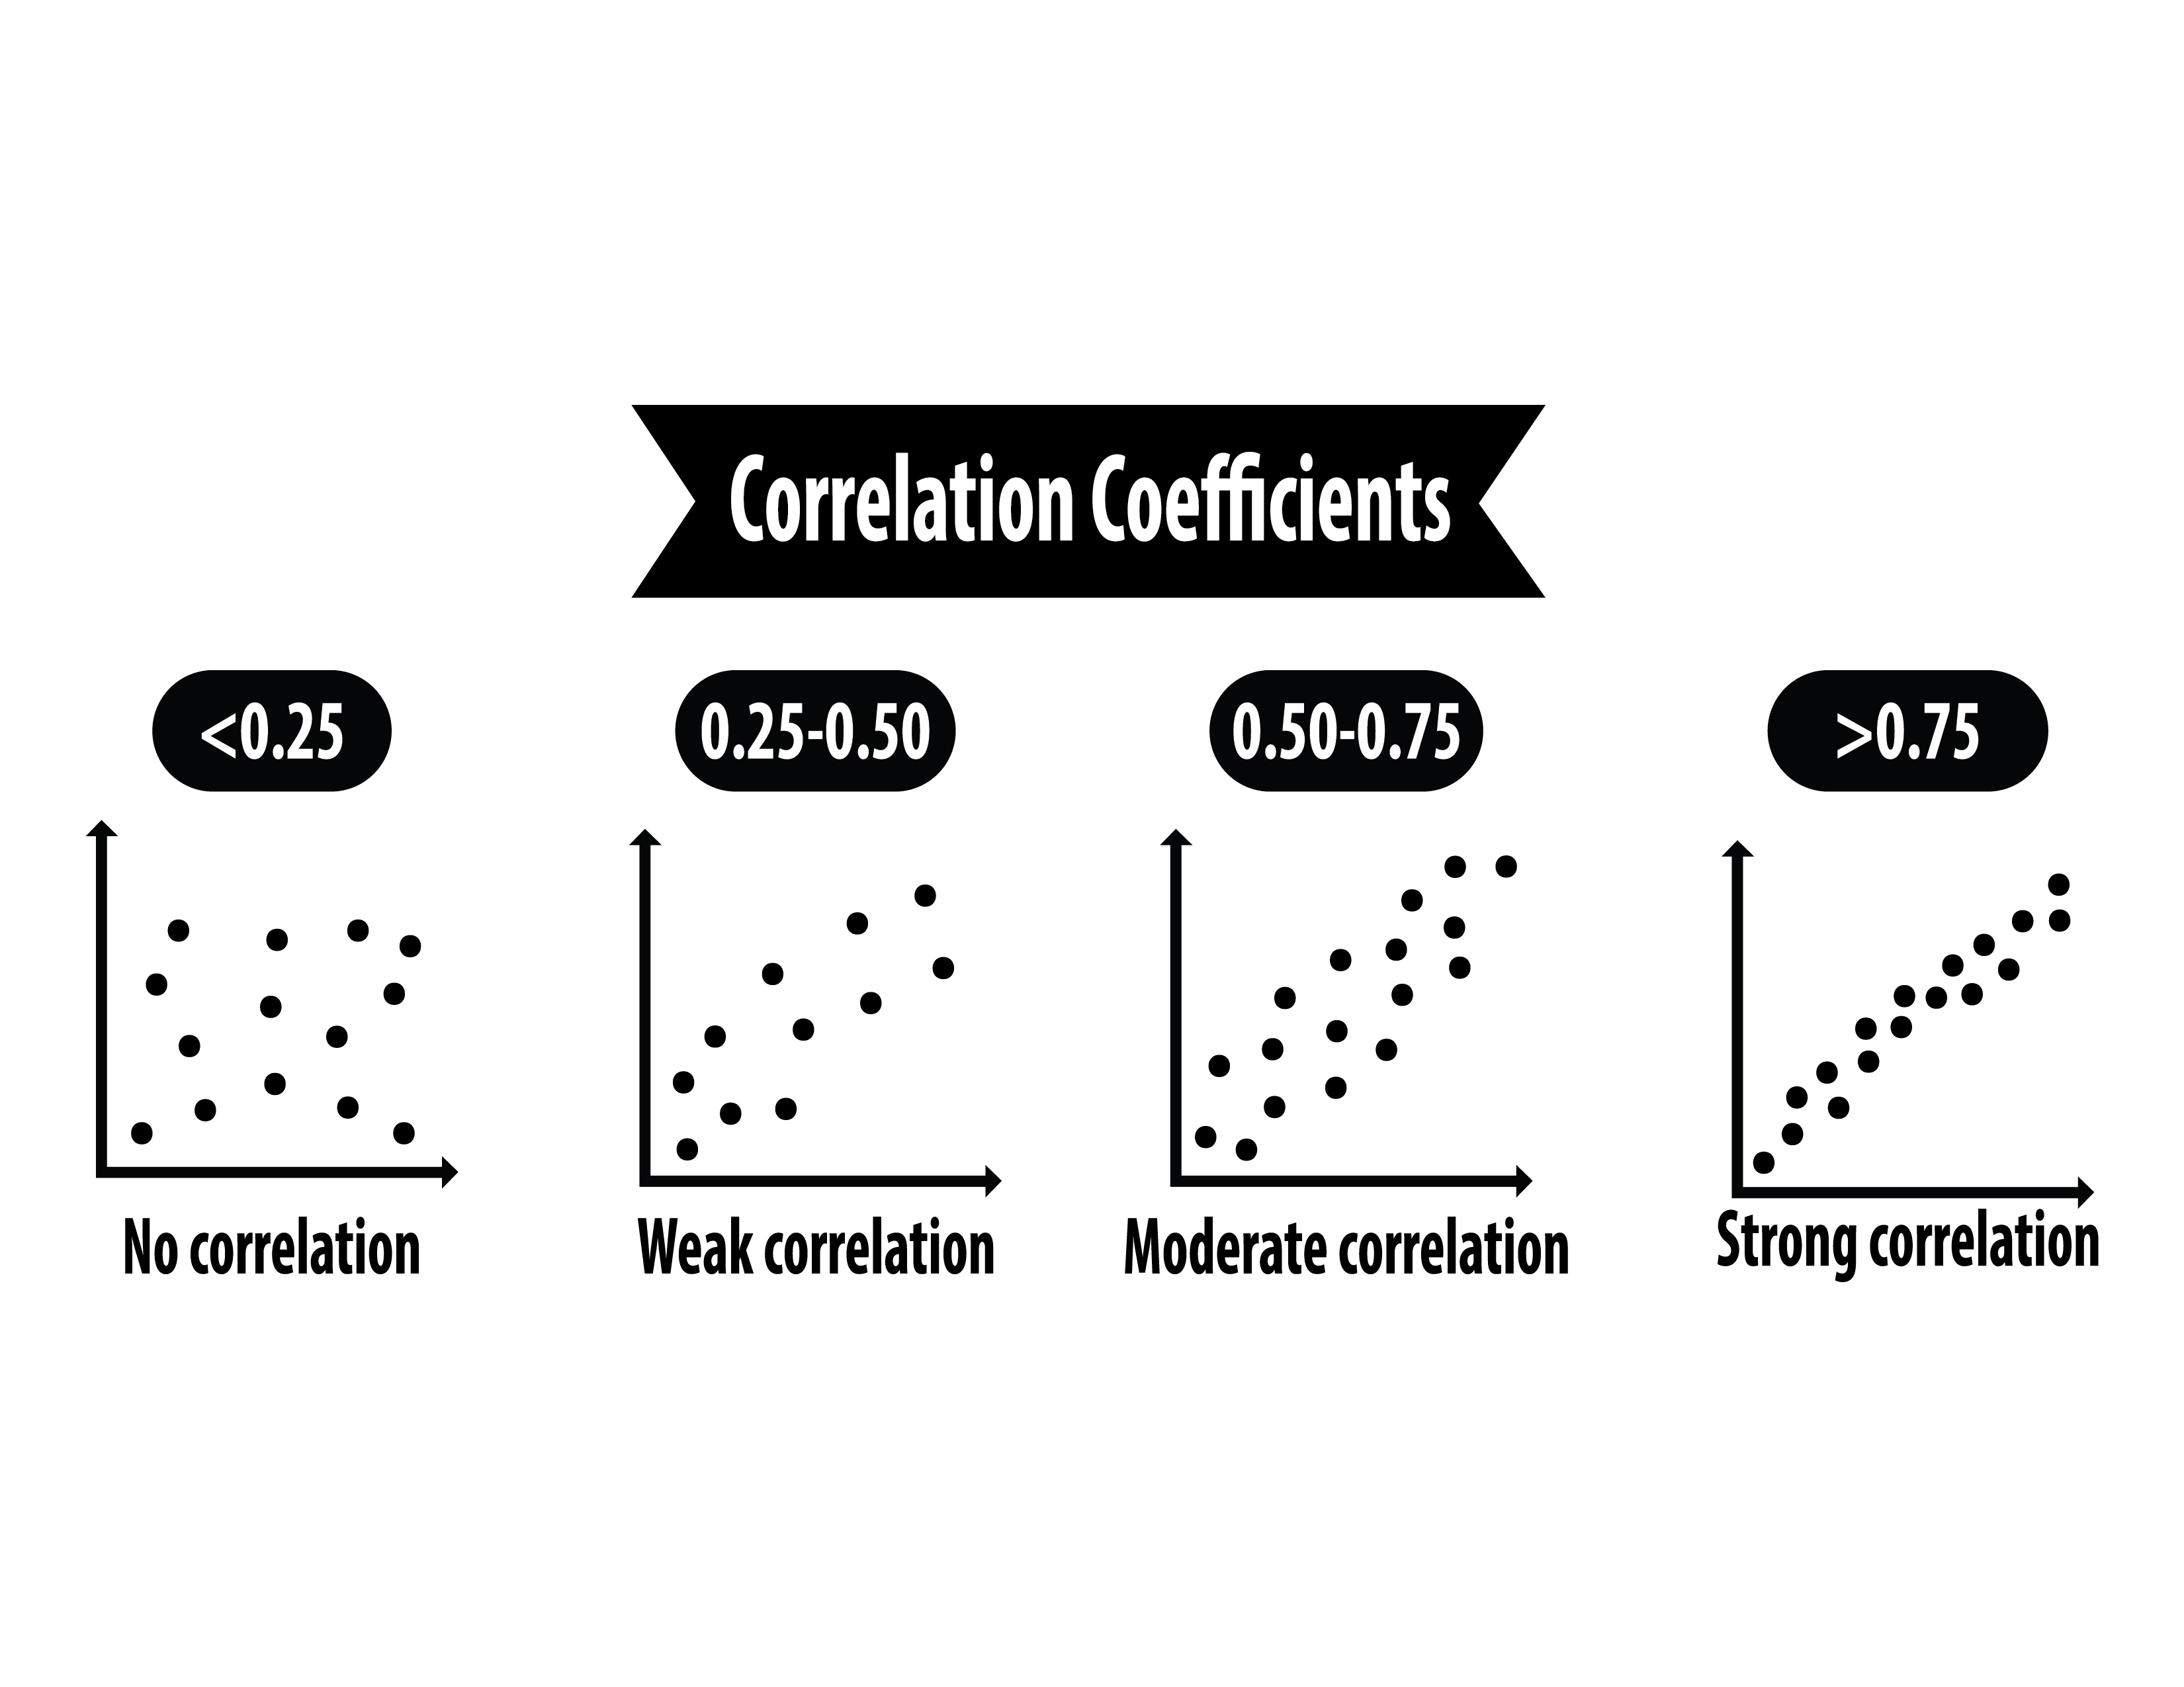
Correlation Coefficient
Correlation coefficient is a number between -1 and 1 that measures the strength of the relationship between two variables. -1 or 1 indicates a perfect negative or positive correlation, while 0 means no linear relationship between the variables.
Pearson Correlation Coefficient
A measure of the linear correlation between two variables X and Y, giving a value between +1 and −1 inclusive,
where 1 is total positive linear correlation, 0 is no linear correlation, and −1 is total negative linear correlation.
Spearman's Rank Correlation Coefficient
A nonparametric measure of rank correlation (statistical dependence between the rankings of two variables).
It assesses how well the relationship between two variables can be described using a monotonic function.
Exponential Dependency
A relationship between two variables where changes in one variable result in exponential changes in another variable.
This relationship is typically represented by an exponential function.
Logarithmic Dependency
A type of relationship between two variables where one variable changes logarithmically as the other variable changes linearly.
This relationship is often represented by a logarithmic function.
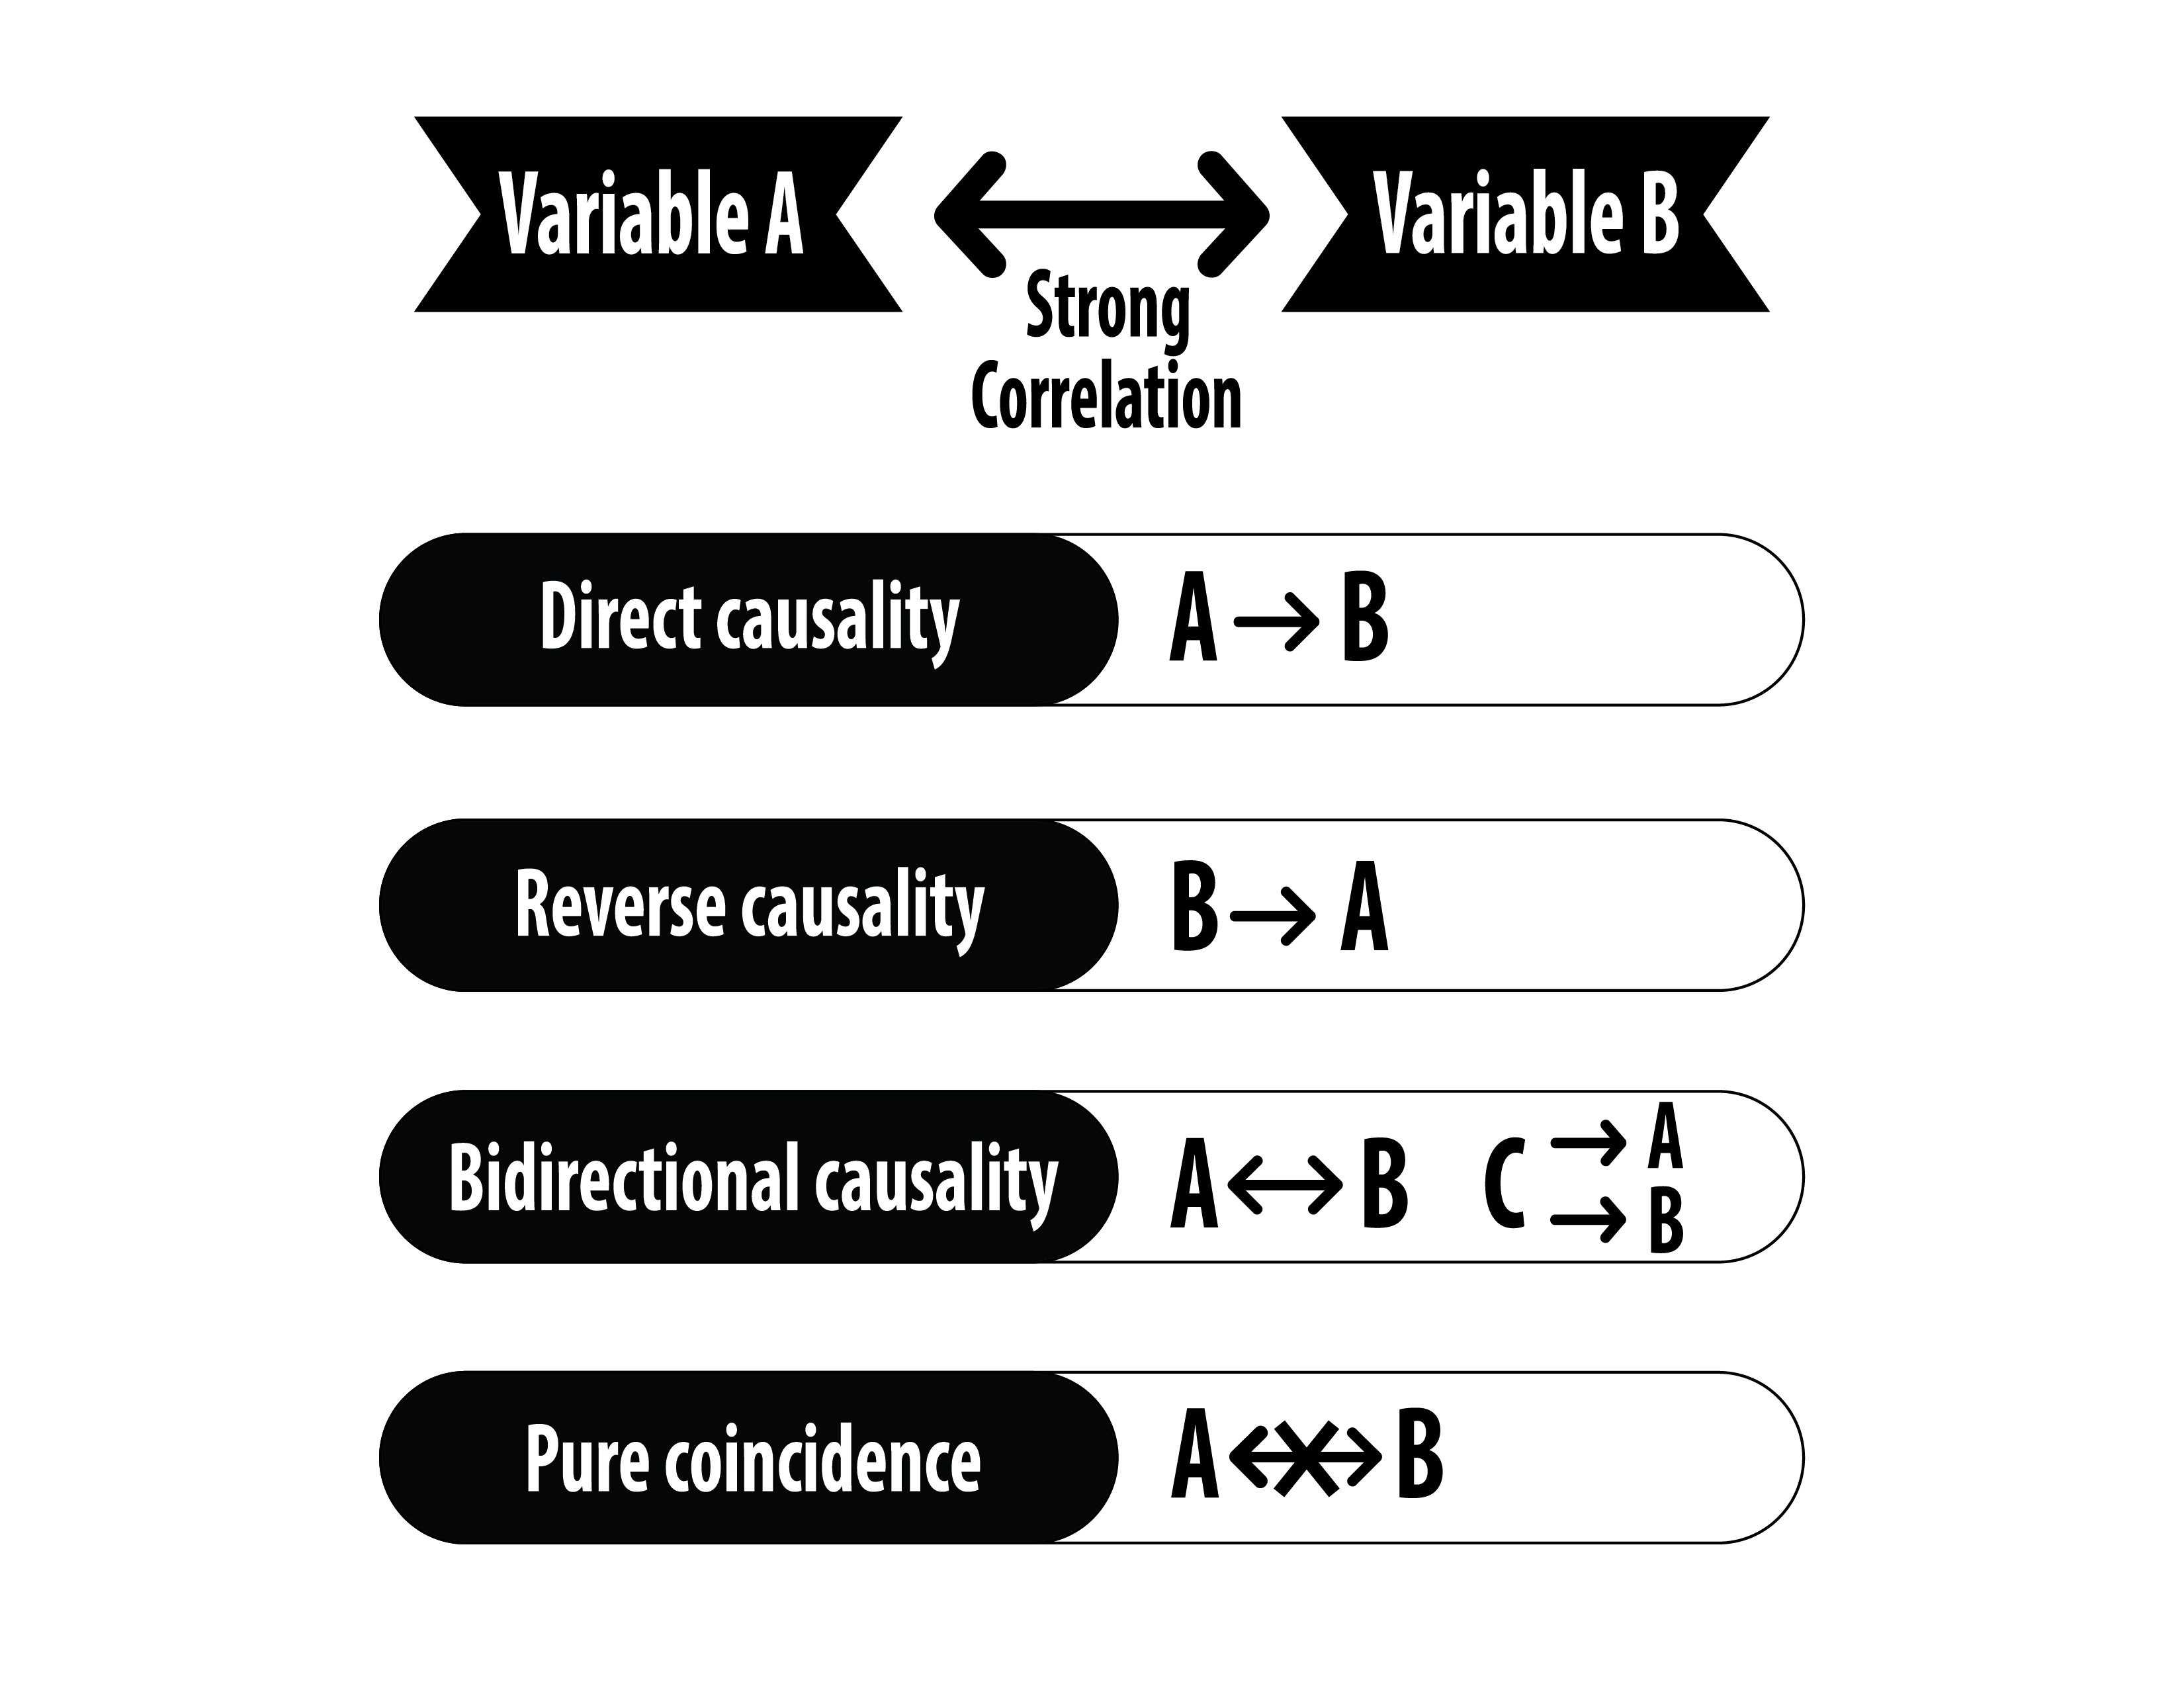
Direct Causality
A relationship between two variables where a change in one variable directly causes a change in the other.
This implies a cause-and-effect relationship where the independent variable influences the dependent variable.
Reverse Causality
When an effect affects its cause. It suggests that a future event can influence a past one. It is discussed in feedback loops and econometric analyses as it can complicate causal interpretations.
Bidirectional Causality
A relationship where two variables affect each other reciprocally.
Changes in one variable lead to changes in the other, and vice versa, indicating a feedback loop or interdependent causal relationship.
Pure Coincidence
An occurrence of two or more events at the same time by chance, without any causal connection.
It refers to situations where the association between the events is not based on cause and effect.
Goodness of Fit
A statistical measure that describes how well a model fits a set of observations.
It determines the extent to which the observed data correspond to the model's predictions.
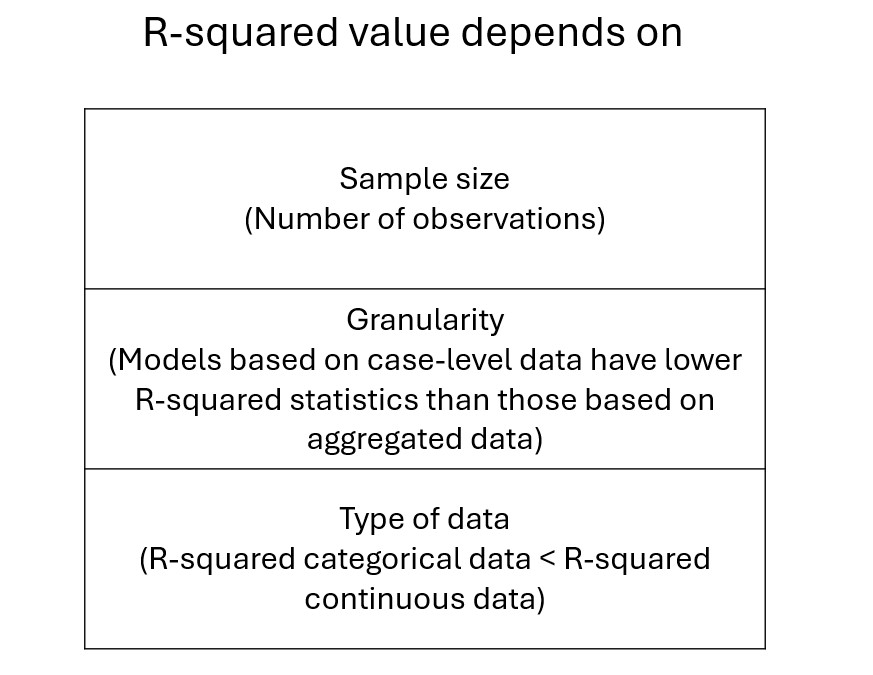
R-squared (Coefficient of determination)
R-squared is a statistical measure that explains how much of the variation in a dependent variable is explained by the independent variable. It ranges from 0 to 1, where 0 means the model doesn't explain any of the variance and 1 means the model explains all the variance.
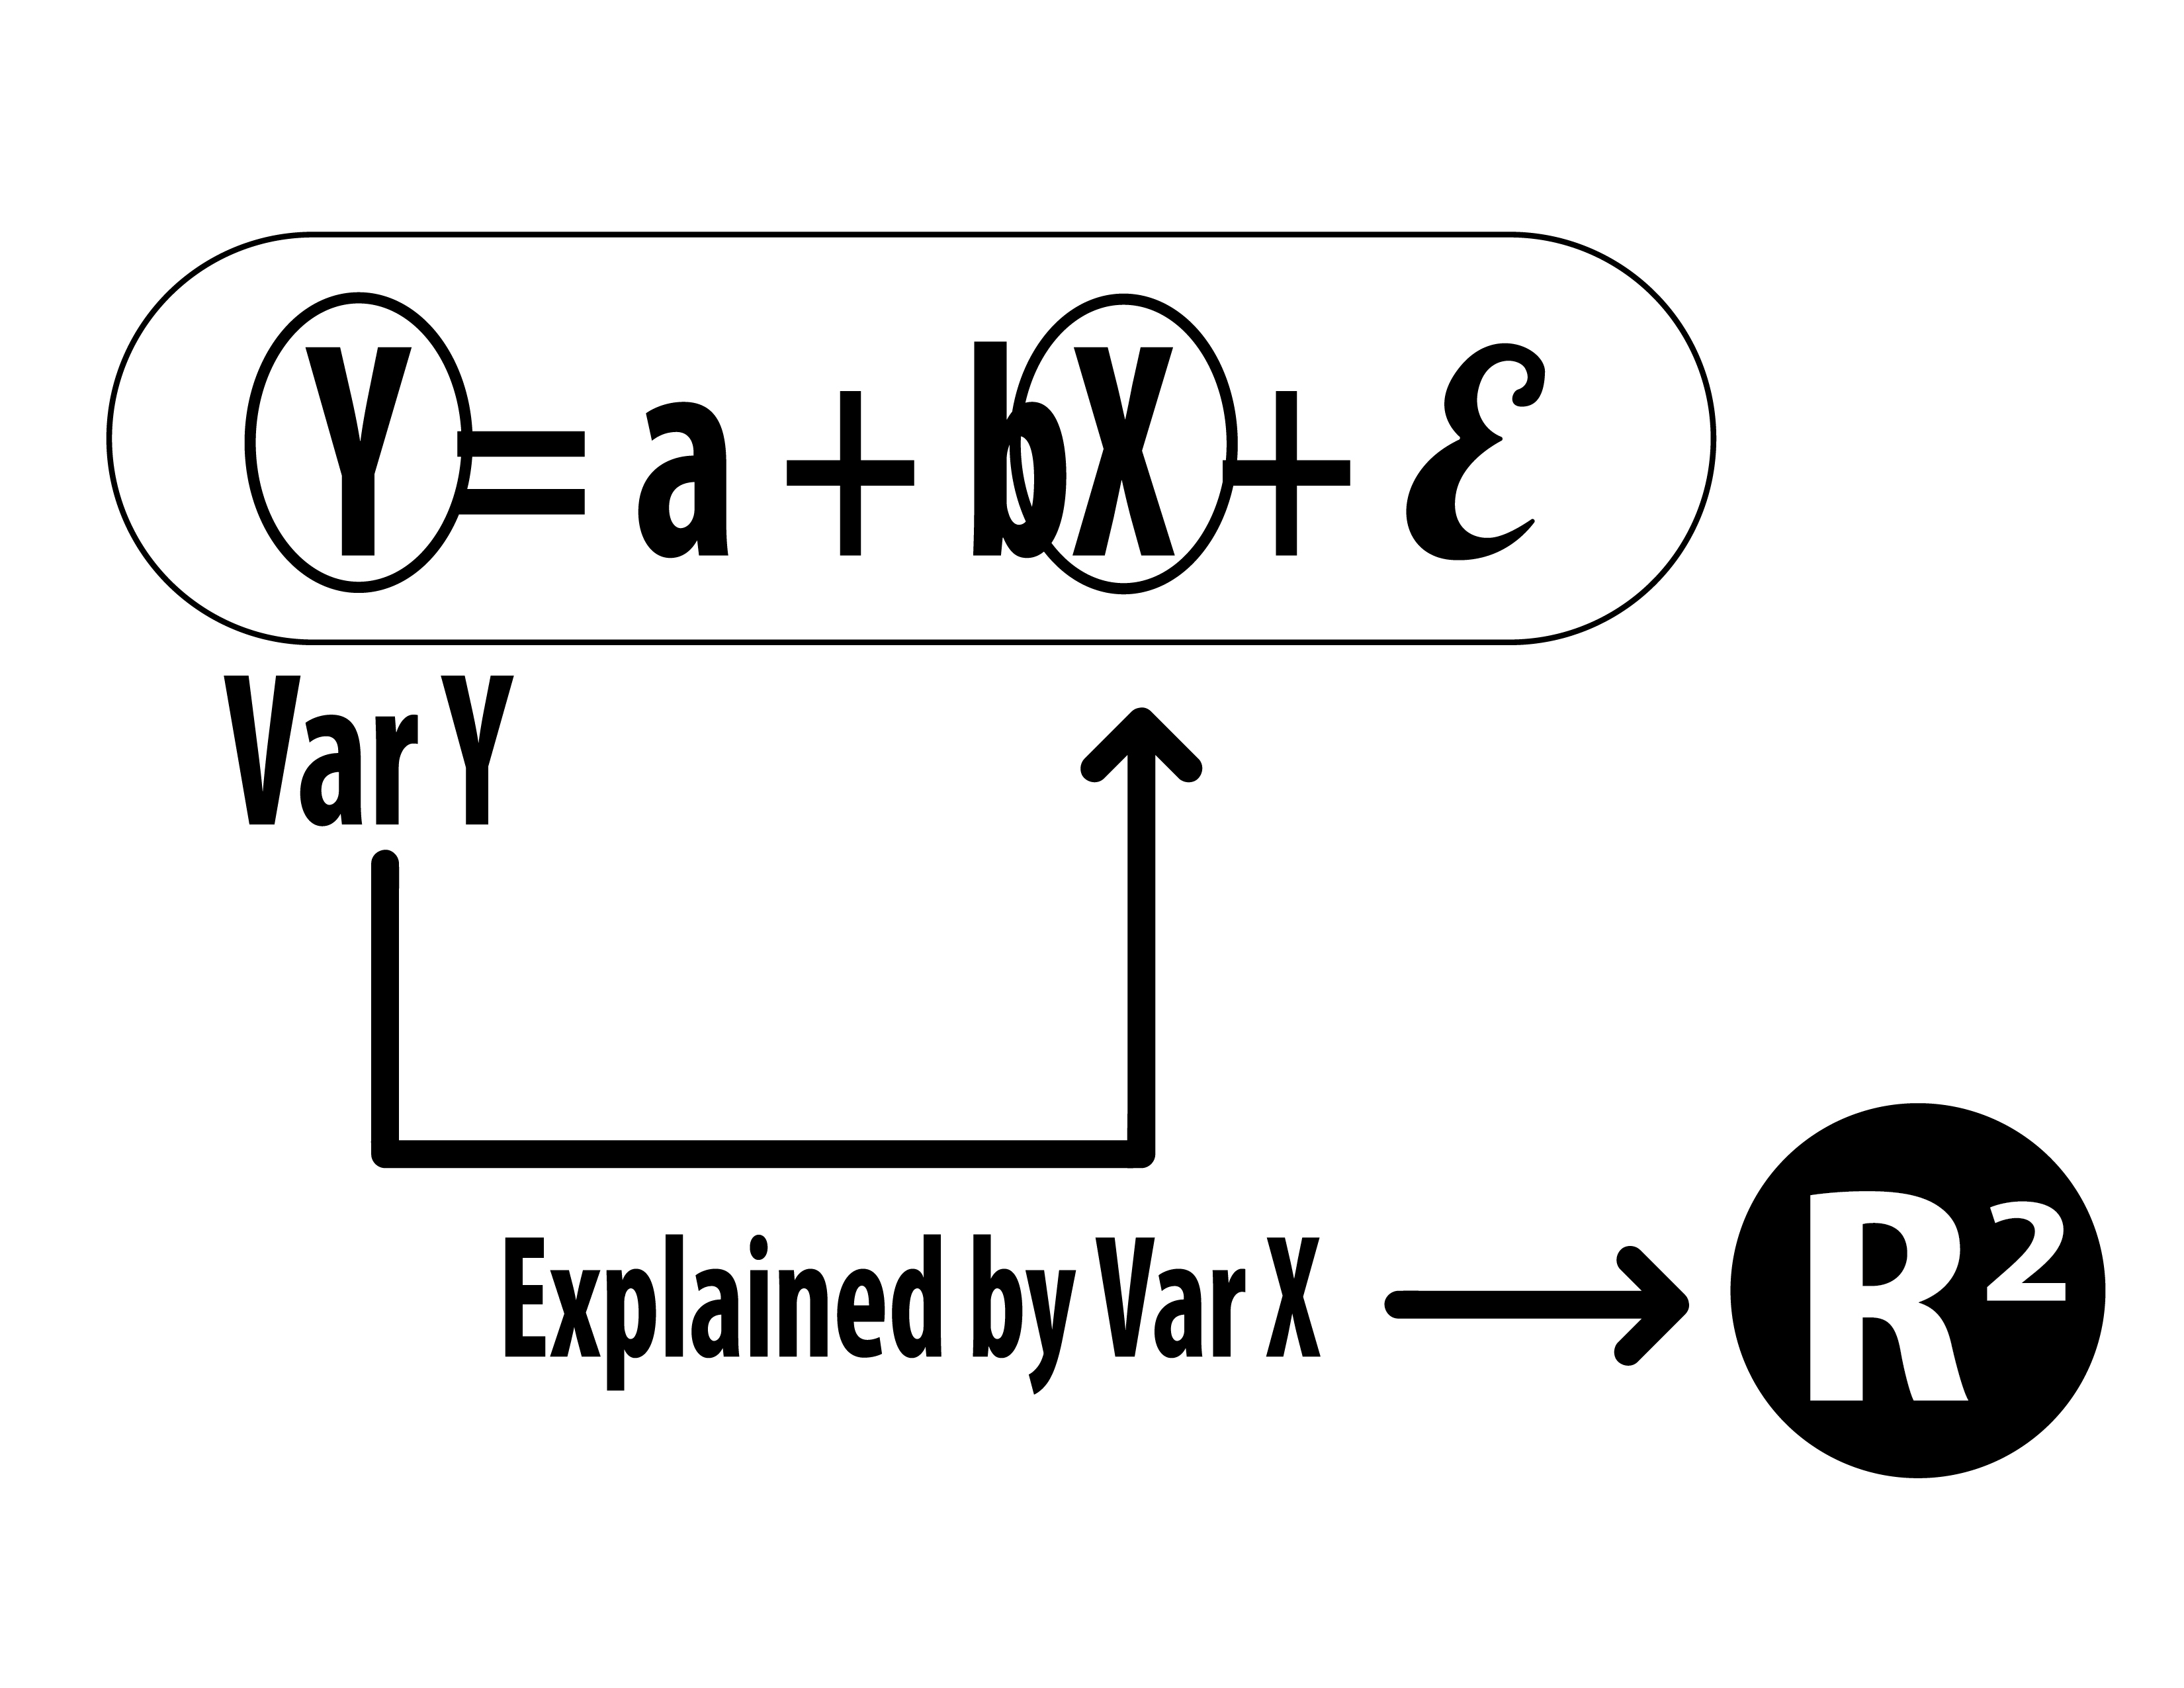
What is a good R-squared value 0.70, 0.50, 0.60, 0.10
0.7
Mean Absolute Error (MAE)
The absolute value of the difference between the predicted and actual events.
Mean Absolute Percentage Error (MAPE)
The sum of the individual absolute errors divided by the underlying value.
MAPE understates the influence of big and rare errors.
Root Mean Square Error (RMSE)
The square root of the average squared error. It gives more importance to the most significant errors.
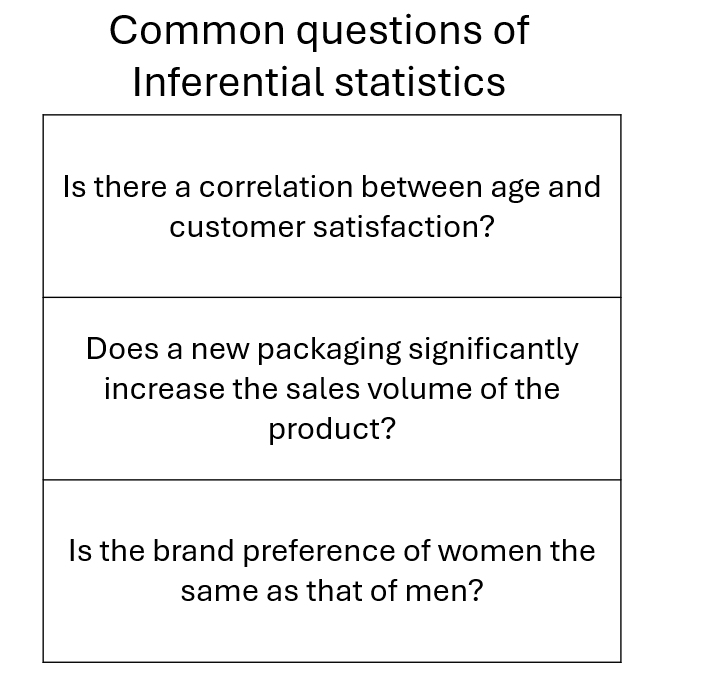
Inferential Statistics
Helps us understand, realize, or know more about populations, phenomena,
and systems that we can't measure otherwise.
Probability
A branch of mathematics dealing with numerical descriptions of how likely an event is to occur.
Hypothesis
A statement that helps communicate an understanding of the question or issue at stake.
Statement
A proposed explanation of a problem derived from limited evidence.
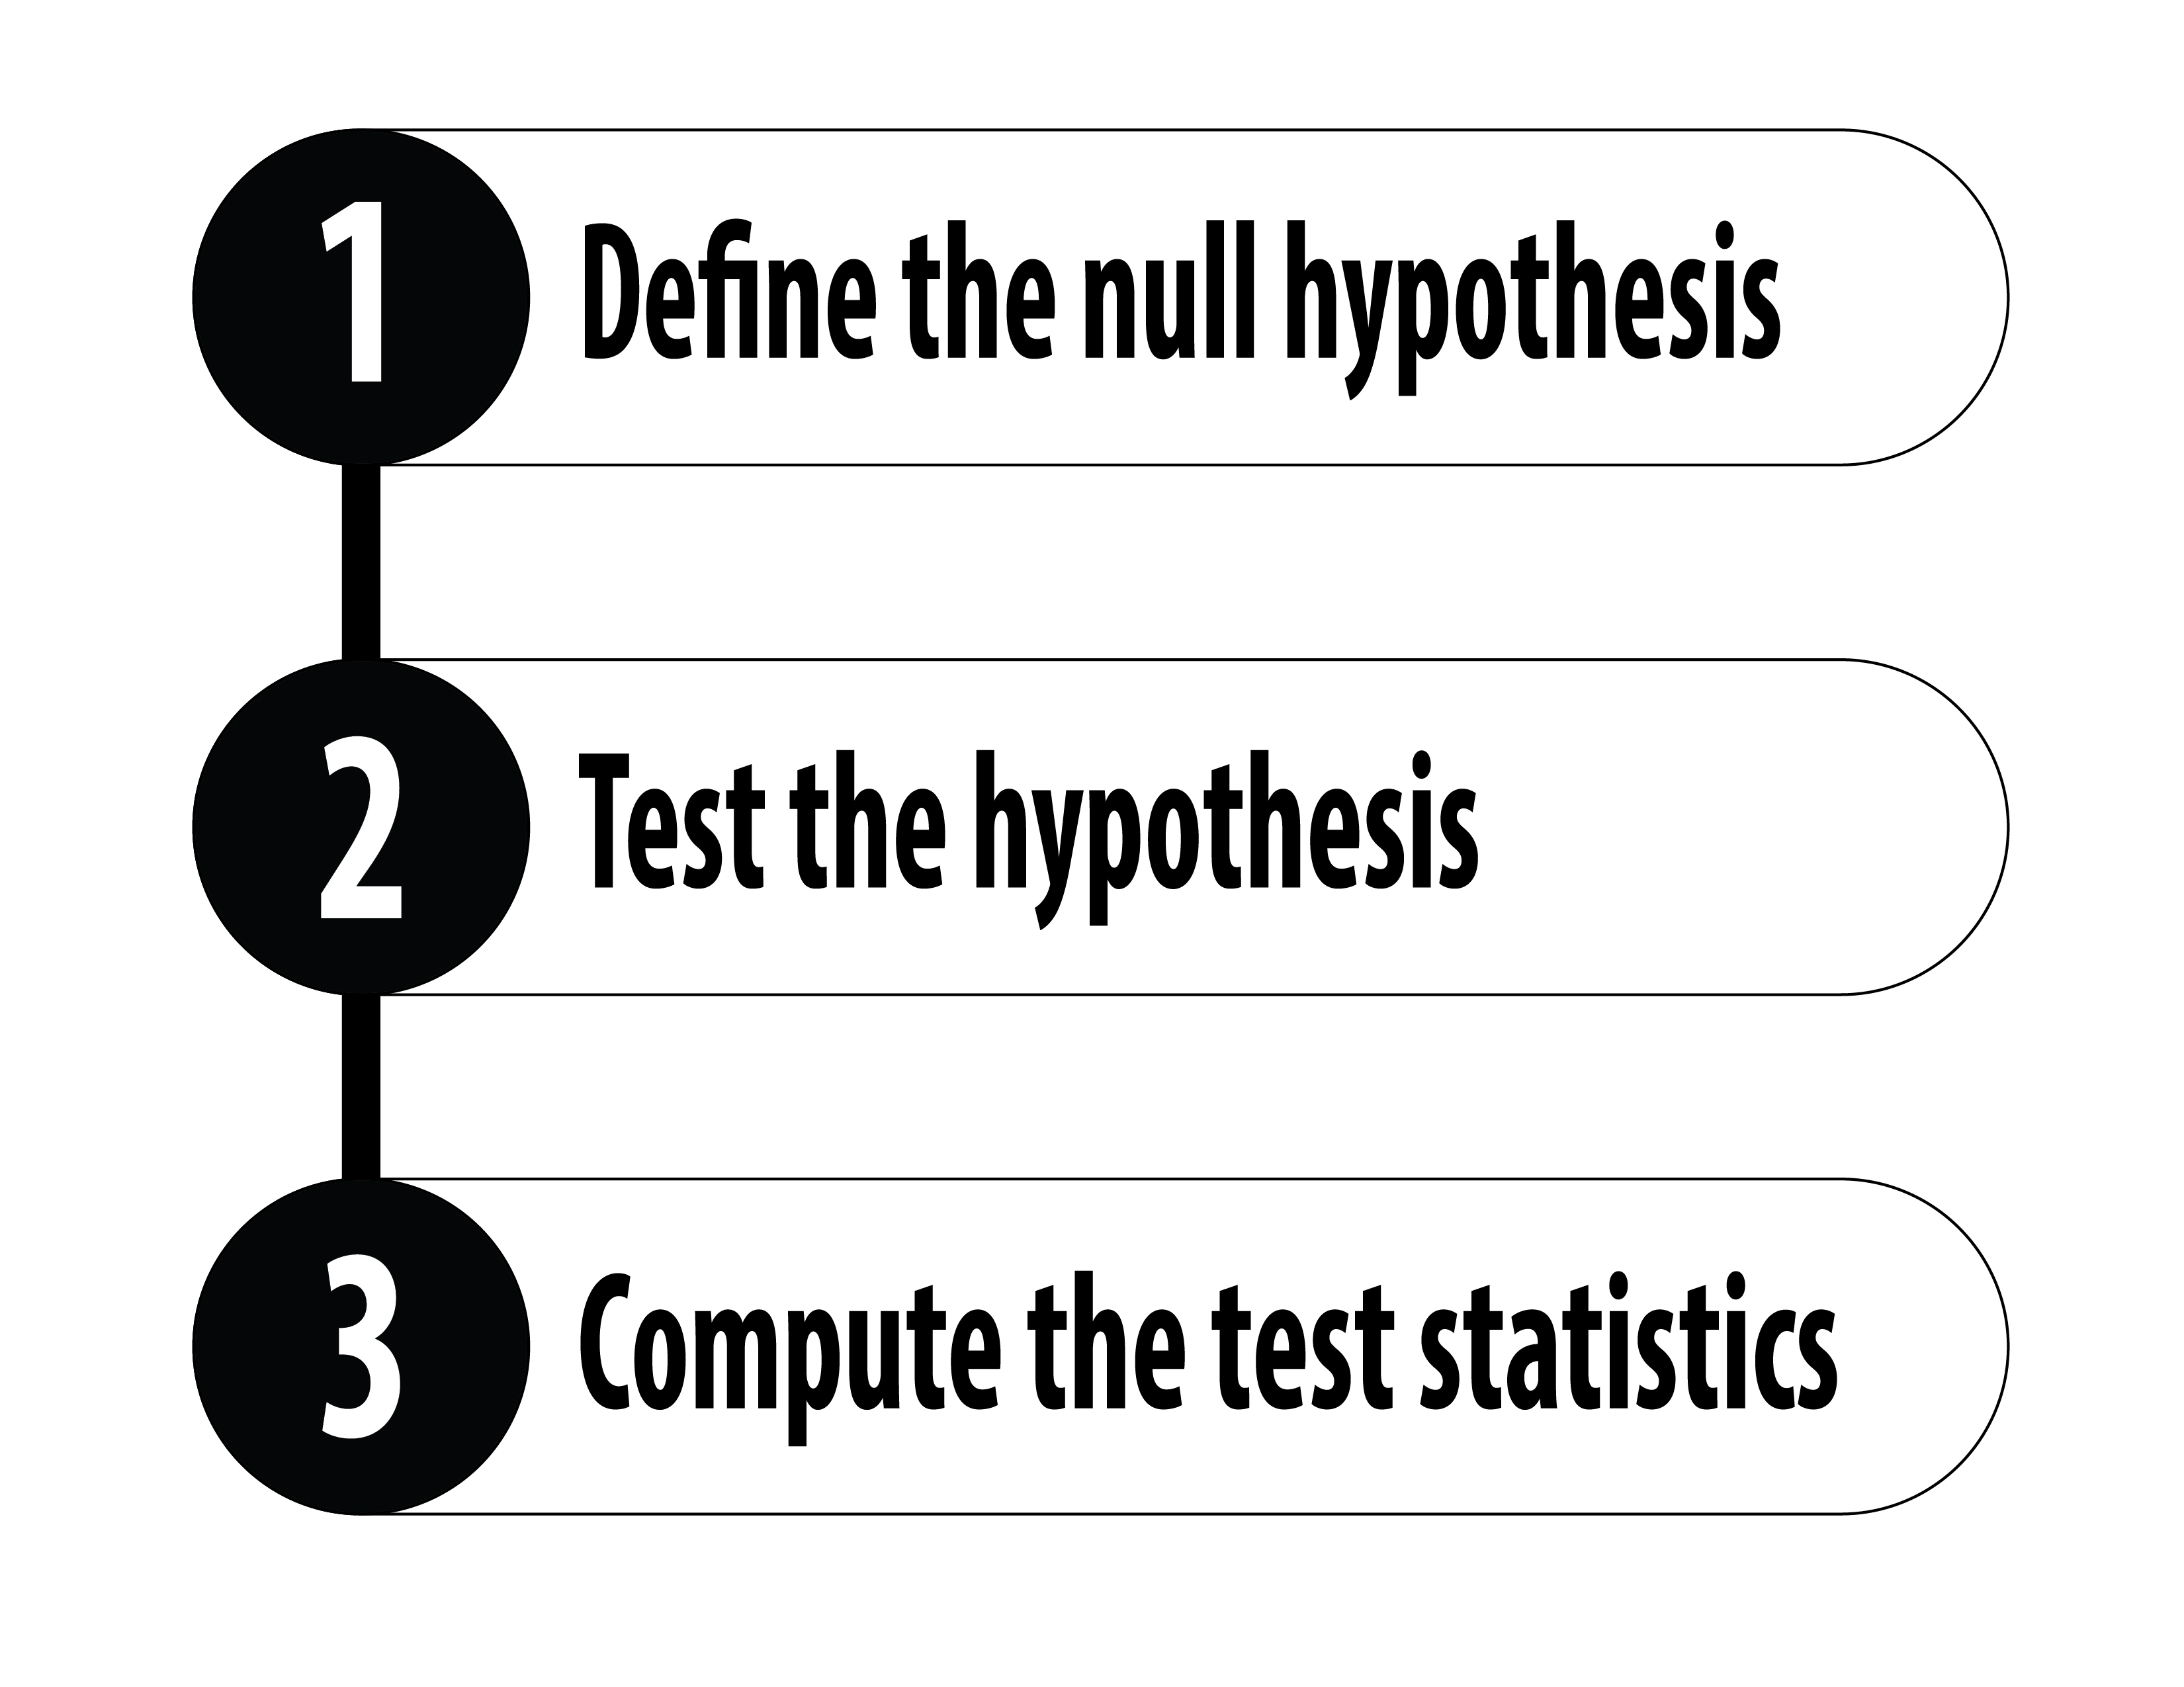
Hypothesis Testing
Determine whether there is enough statistical evidence in favour of a certain idea, assumption (e.g. about a population parameter), or the hypothesis itself.
The process involves testing an assumption regarding a population by measuring and analyzing a random sample taken from that population.
Null Hypothesis (H0)
A statement or default position that there is no association between two measured phenomena or no association among groups.
In hypothesis testing, it is the hypothesis to be tested and possibly rejected in favor of an alternative hypothesis.
Alternative Hypothesis (H1)
What you believe to be true or hope to prove to be true.
P-value
A measure of the probability that an observed result occurred by chance. The smaller the P-value, the stronger the evidence that you should reject H0.
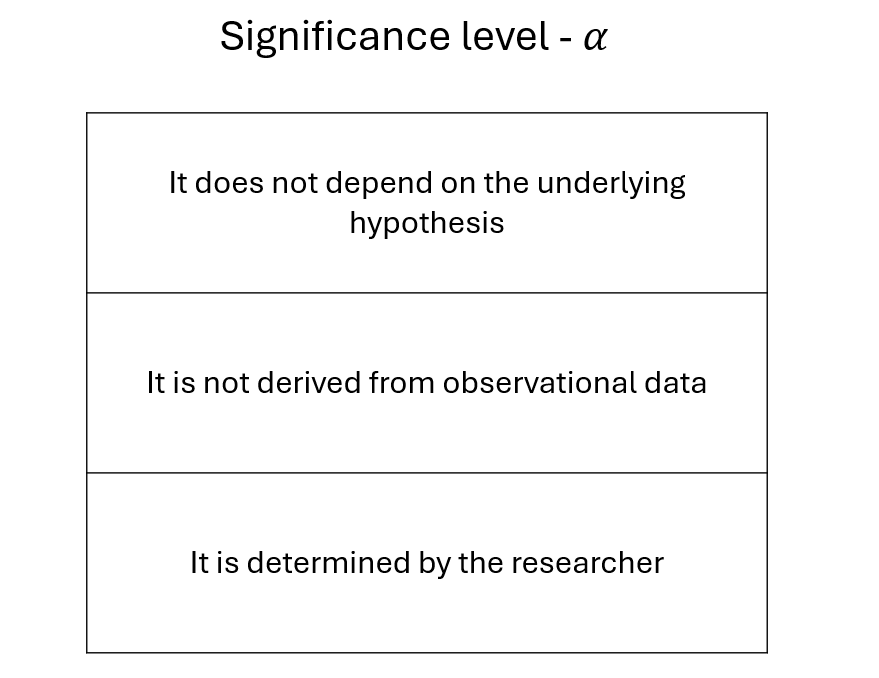
Significance Level
The strength of evidence that must be presented to reject the null hypothesis.
A/B Testing
A randomized experiment with two variants, A and B, which are the control and treatment in the experiment.
It's used to compare two versions of a product or service to determine which one performs better in terms of specific metrics.
Business Intelligence (BI)
Comprises the strategies and technologies used by enterprises for the data analysis of business information.
Enterprise Reporting
The regular creation and distribution of reports across the organization to depict business performance.
Dashboarding
The provision of displays that visually track key performance indicators (KPIs)
relevant to a particular objective or business process.
Online Analytical Processing (OLAP)
An approach that enables users to query from multiple database systems at the same time.
Fiancial Planning and Analysis (FP&A)
A set of activities that support an organization's health in terms of financial planning, forecasting, and budgeting.
Business Sphere
A visually immersive data environment that facilitates decision-making
by channelling real-time business information from around the world.
Machine Learning
Find hidden insights without being explicitly programmed where to look.
Make predictions based on data and findings.
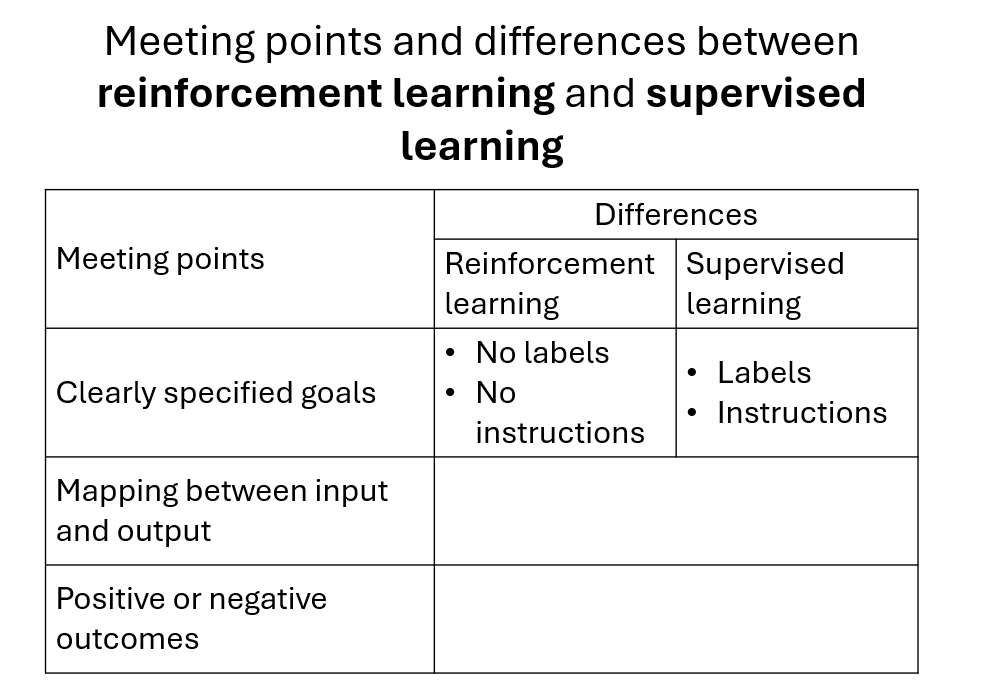
Supervised Learning
A type of machine learning where the model is trained on a labeled dataset,
which means it learns from input data that is tagged with the correct output, facilitating the model to accurately predict the output when given new data.
Algorithm
A procedure for solving a mathematical problem for a finite number of steps
that frequently involves repetition of an operation. It can take several iterations for the algorithm to produce a good enough solution to the problem.
Training Data
Units of information that teach the machine trends and similarities derived from the data.
Training the Model
The process through which the algorithm goes through the training data again and again,
and helps the model make sense of the data.
Regression
A supervised machine learning method used for determining
the strength and character of a relationship between a dependent variable and one or more independent variables. Works with continuous data.
Dependent Variable
The one to be explained or predicted.
Independent Variable
The ones used to make a prediction. Also called "predictors".
Forecasting
A sub-discipline of prediction, and its predictions are made specifically about the future.
Polynomial Regression
Polynomial regression models the relationship between x and y as an nth-degree polynomial, fitting a nonlinear relationship between the value of x and the corresponding mean of y.
Multivariable Regression
A technique used to model the relationship between two or more independent variables and a single dependent variable.
It assesses how much variance in the dependent variable can be explained by the independent variables.
Time Series
A sequence of discrete time data, taken at particular time intervals.
Time Series Forecasting
Uses models to predict future values based on previously observed values.
Time Series Analysis
A supervised machine learning approach that predicts the future values of a series,
based on the history of that series. Input and output are arranged as a sequence of time data.
Classification
A supervised machine learning approach where observations are assigned to classes.
The output is categorical data where the categories are known in advance.
Marketing Mix Modeling
A technique used to analyze and optimize the different components of a marketing strategy
(often framed as the 4Ps: product, price, place, promotion) to understand their effect on sales or market share.
Unsupervised Learning
Unsupervised machine learning identifies patterns and structures without labeled responses or a guiding output.
Clustering
An unsupervised machine learning approach that involves splitting a data set into a number of categories,
which can be referred to as classes or labels. A clustering algorithm automatically identifies the categories..
Clustering Algorithm
Has the objective of grouping the data in a way that maximizes both the homogeneity within and
the heterogeneity between the clusters.
Association Rule Learning
An unsupervised machine learning technique used to discover interesting associations hidden in large data sets.
Market Basket Analysis
The exploration of customer buying patterns by finding associations between items
that shoppers put in their baskets.
Reinforcement Learning
A machine ("agent") learns through trial and error, using feedback from its own actions.
Deep Learning
Applies methods inspired by the function and structure of the brain.
Artificial Neural Networks (ANN)
Computing systems inspired by the biological neural networks that constitute animal brains.
These systems learn to perform tasks by considering examples, generally without being programmed with task-specific rules.
Natural Language Processing (NLP)
A field of artificial intelligence concerned with the interactions between computers and the human language.
Natural Language Understanding (NLU)
Deals with the reading comprehension of machines and sentiment analysis.
Natural Language Generation (NLG)
Deals with the creation of meaningful sentences in the form of natural language.
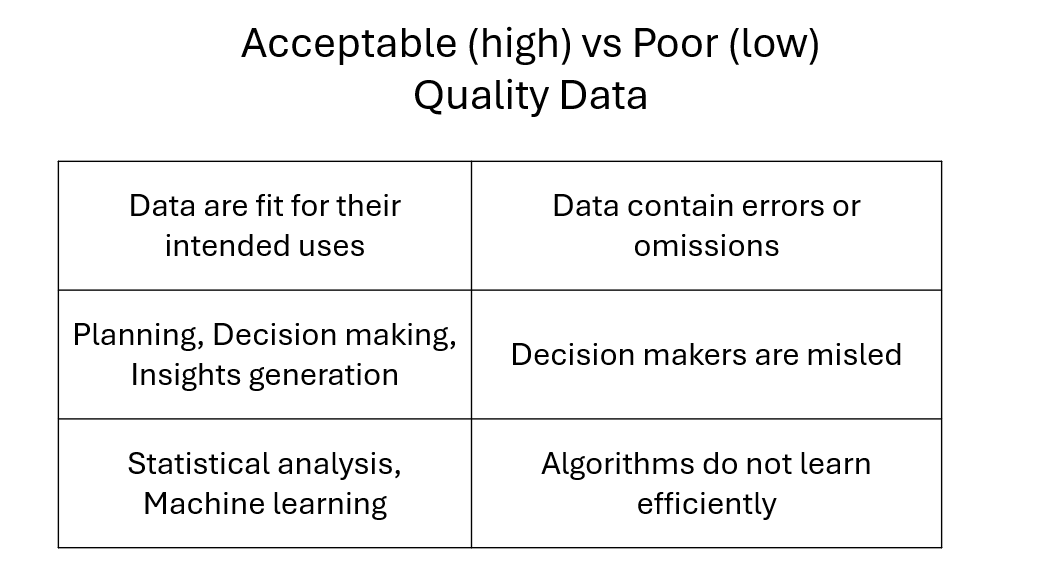
Data Quality
The degree to which data is accurate, complete, timely, consistent, relevant,
and reliable to meet the needs of its usage.
GIGO
Garbage in. Garbage out. Without meaningful data, you cannot get meaningful results.
Out-of-sample Validation
A method of evaluating the predictive performance of a model on a new,
unseen dataset to test the model's ability to generalize beyond the data it was trained on.
Confusion Matrix
Shows the actual and predicted classes of a classification problem.
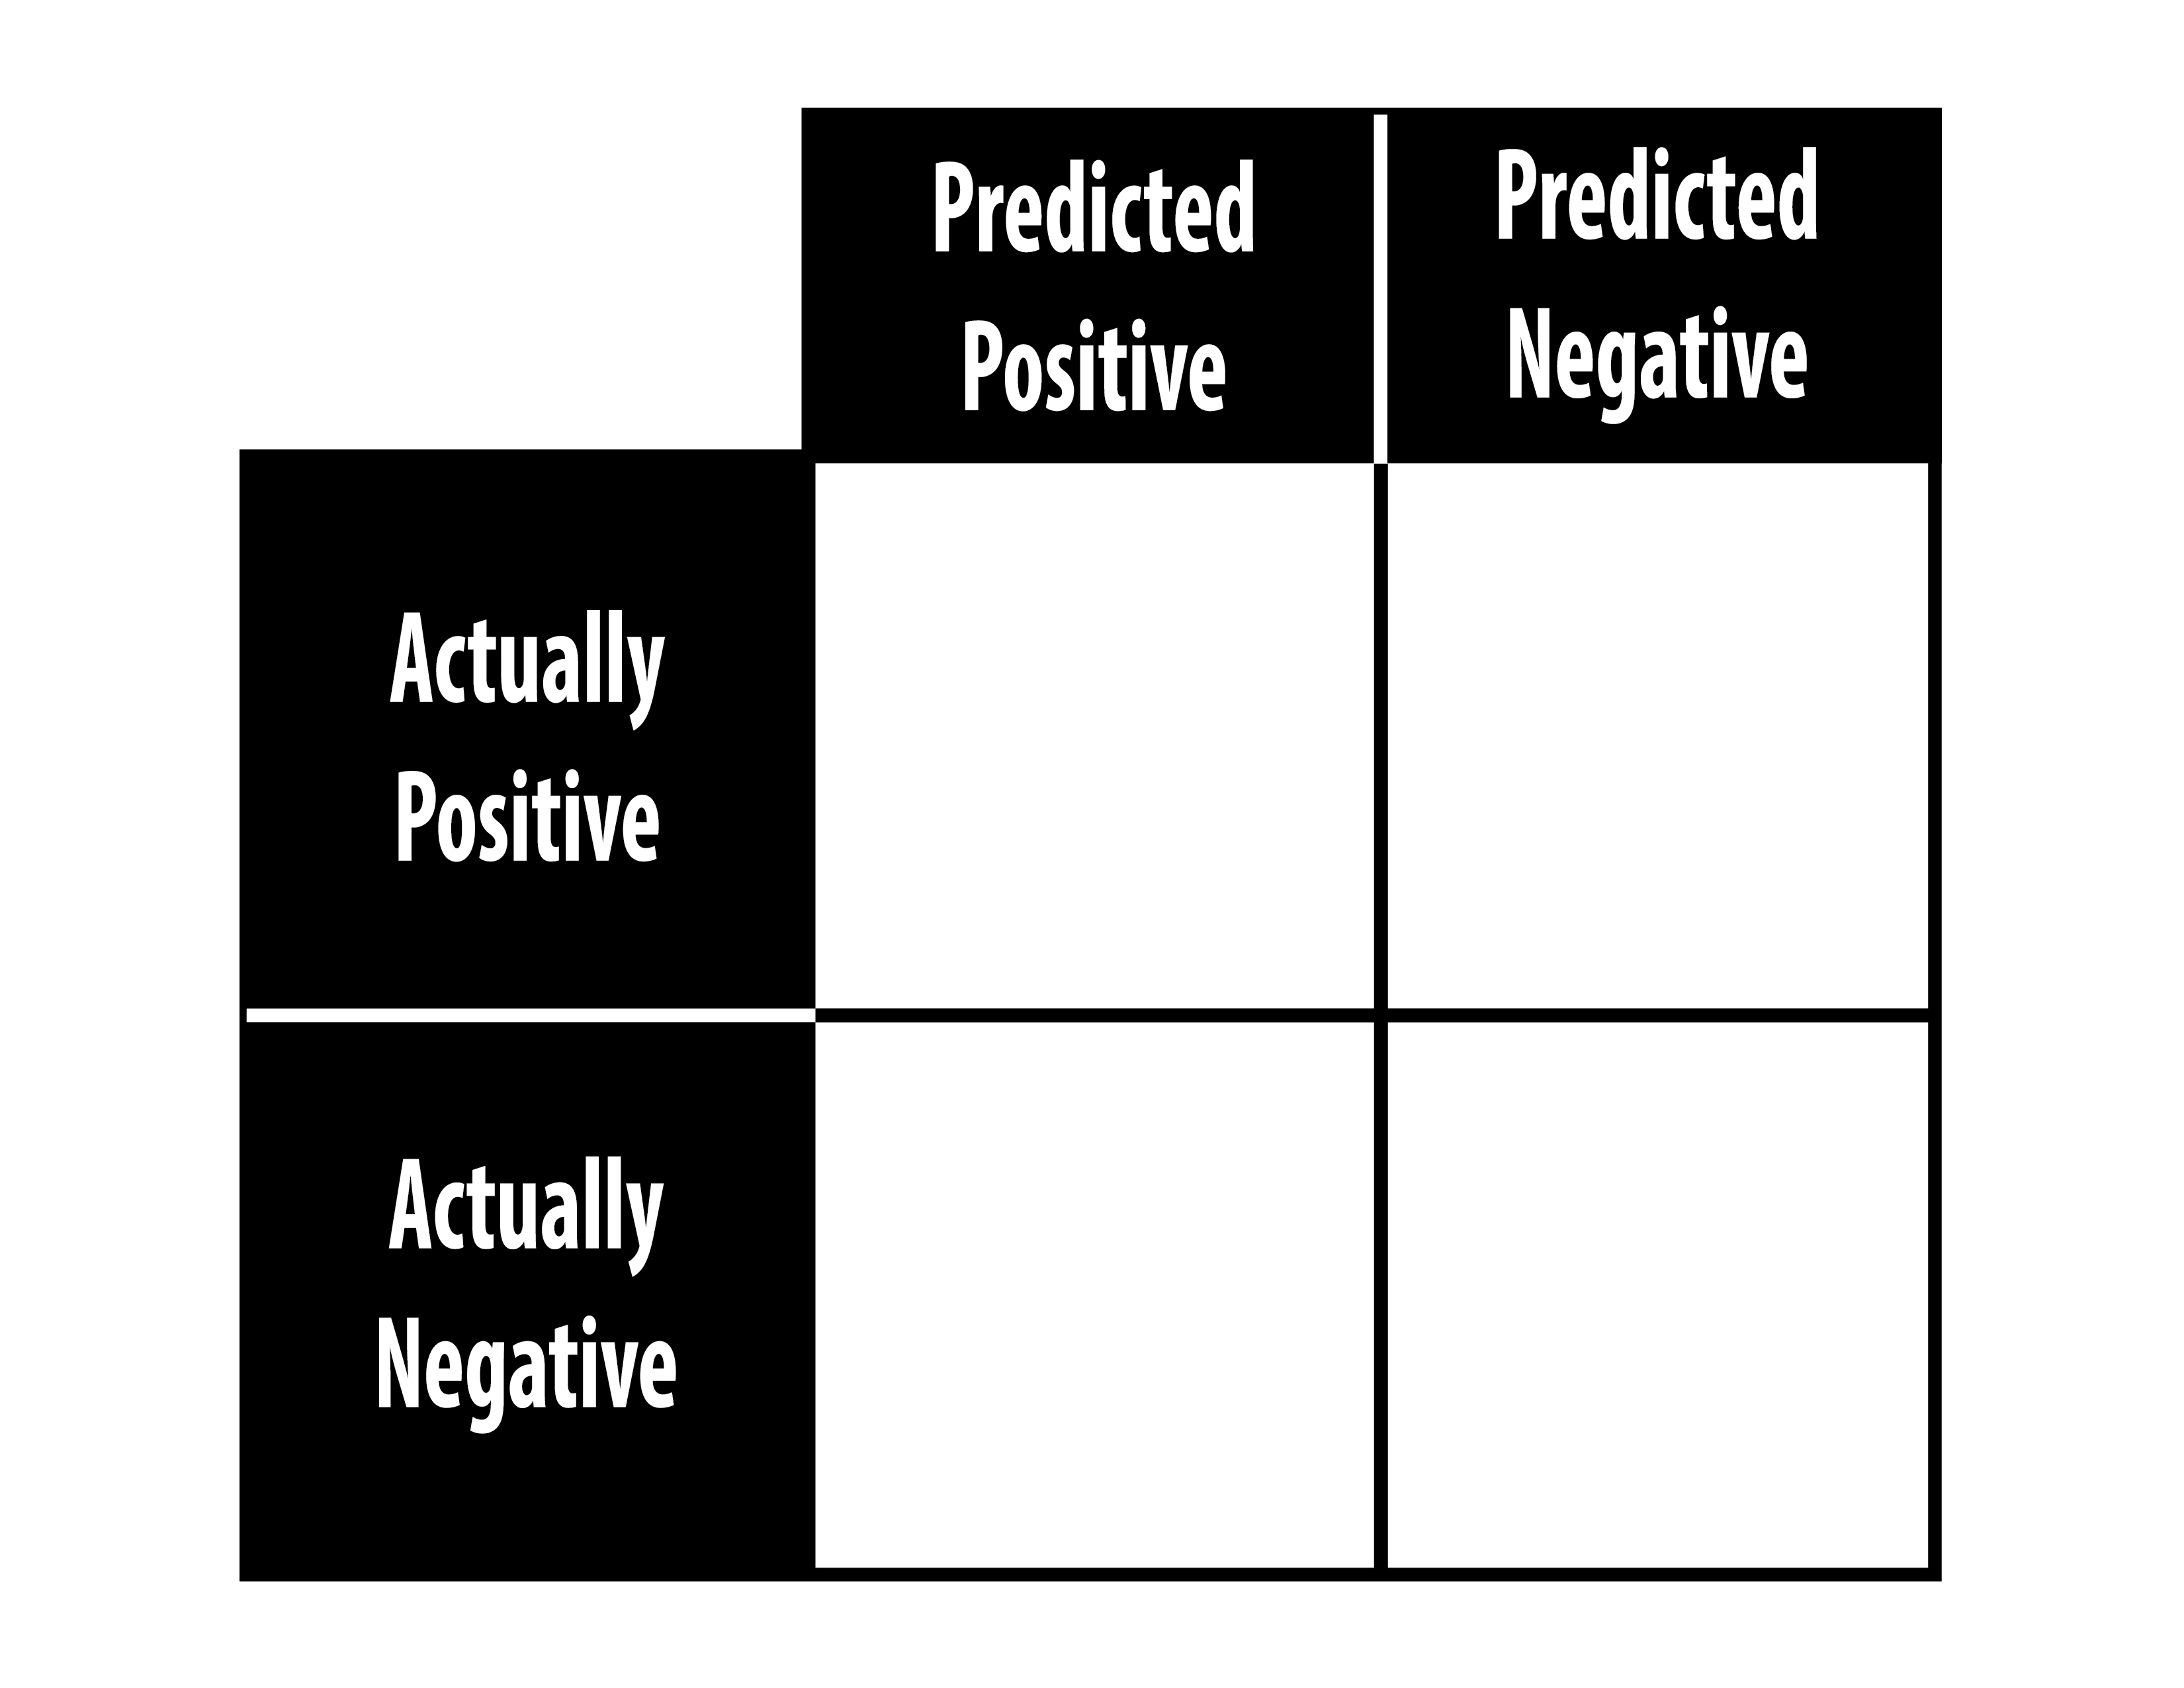
Accuracy
The proportion of the total number of correct predictions.

Recall
The ability of a classification model to identify all relevant instances.

Precision
The ability of a classification model to return only relevant instances.

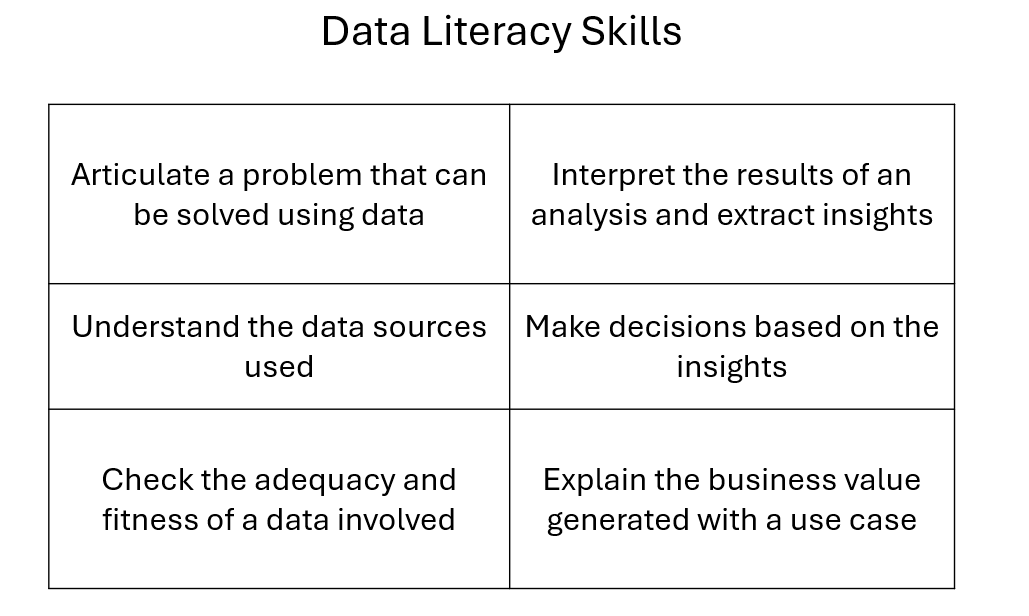
Data Literacy Skills
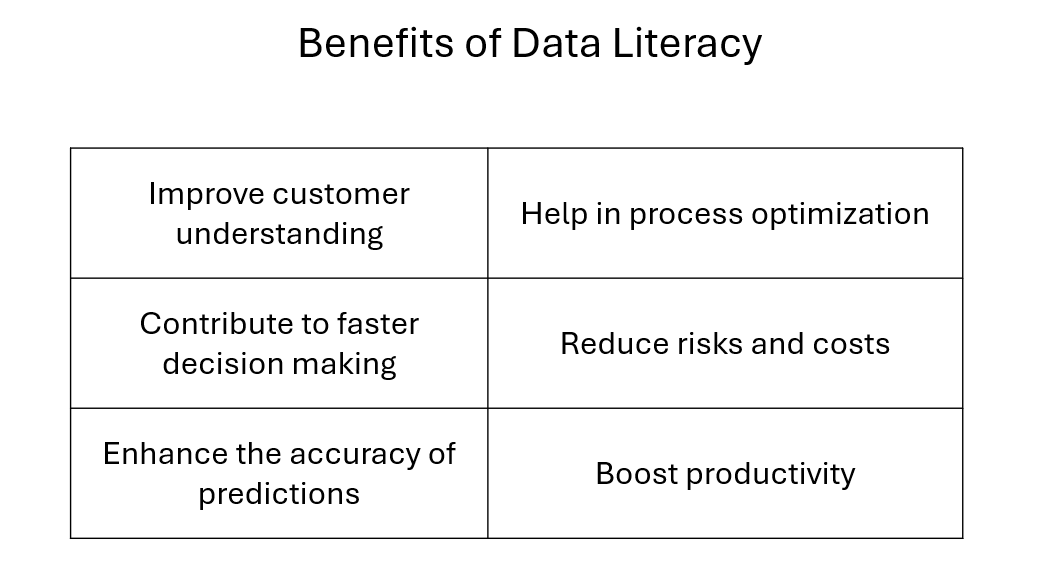
Benefits of Data Literacy
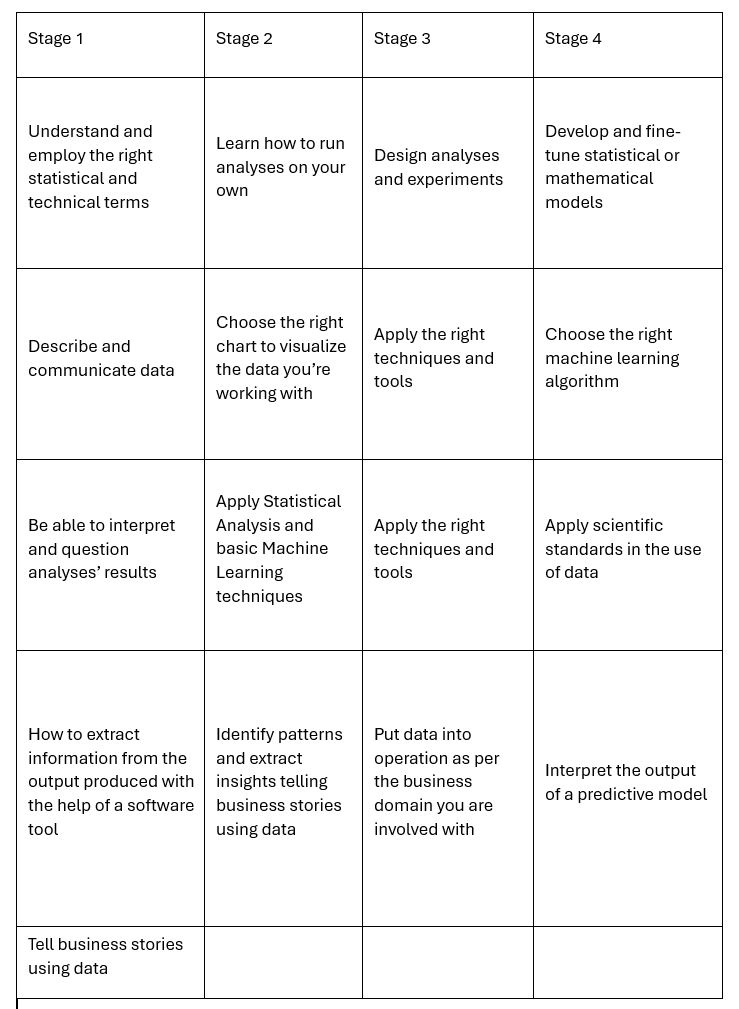
Data Literacy Journey
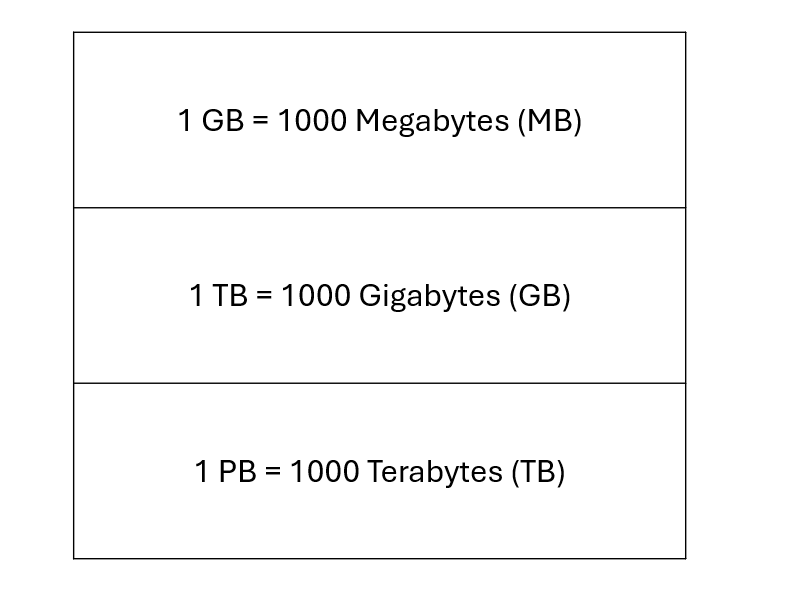
Volume Measures
Data warehouse Characteristics
Advantages of Data Marts
Data Lake vs. Data Warehouse
In Cloud Storage vs. On-Premise Storage
Benefits of Fog Computing
Data Analysis vs. Data Analytics
How to calculate the mode?
Types of Correlation Coefficient
Types of Causality
What does R-squared depend on?
Common Questions about Inferential Statistics
Steps for Hypothesis Testing
Significance Level Characteristics
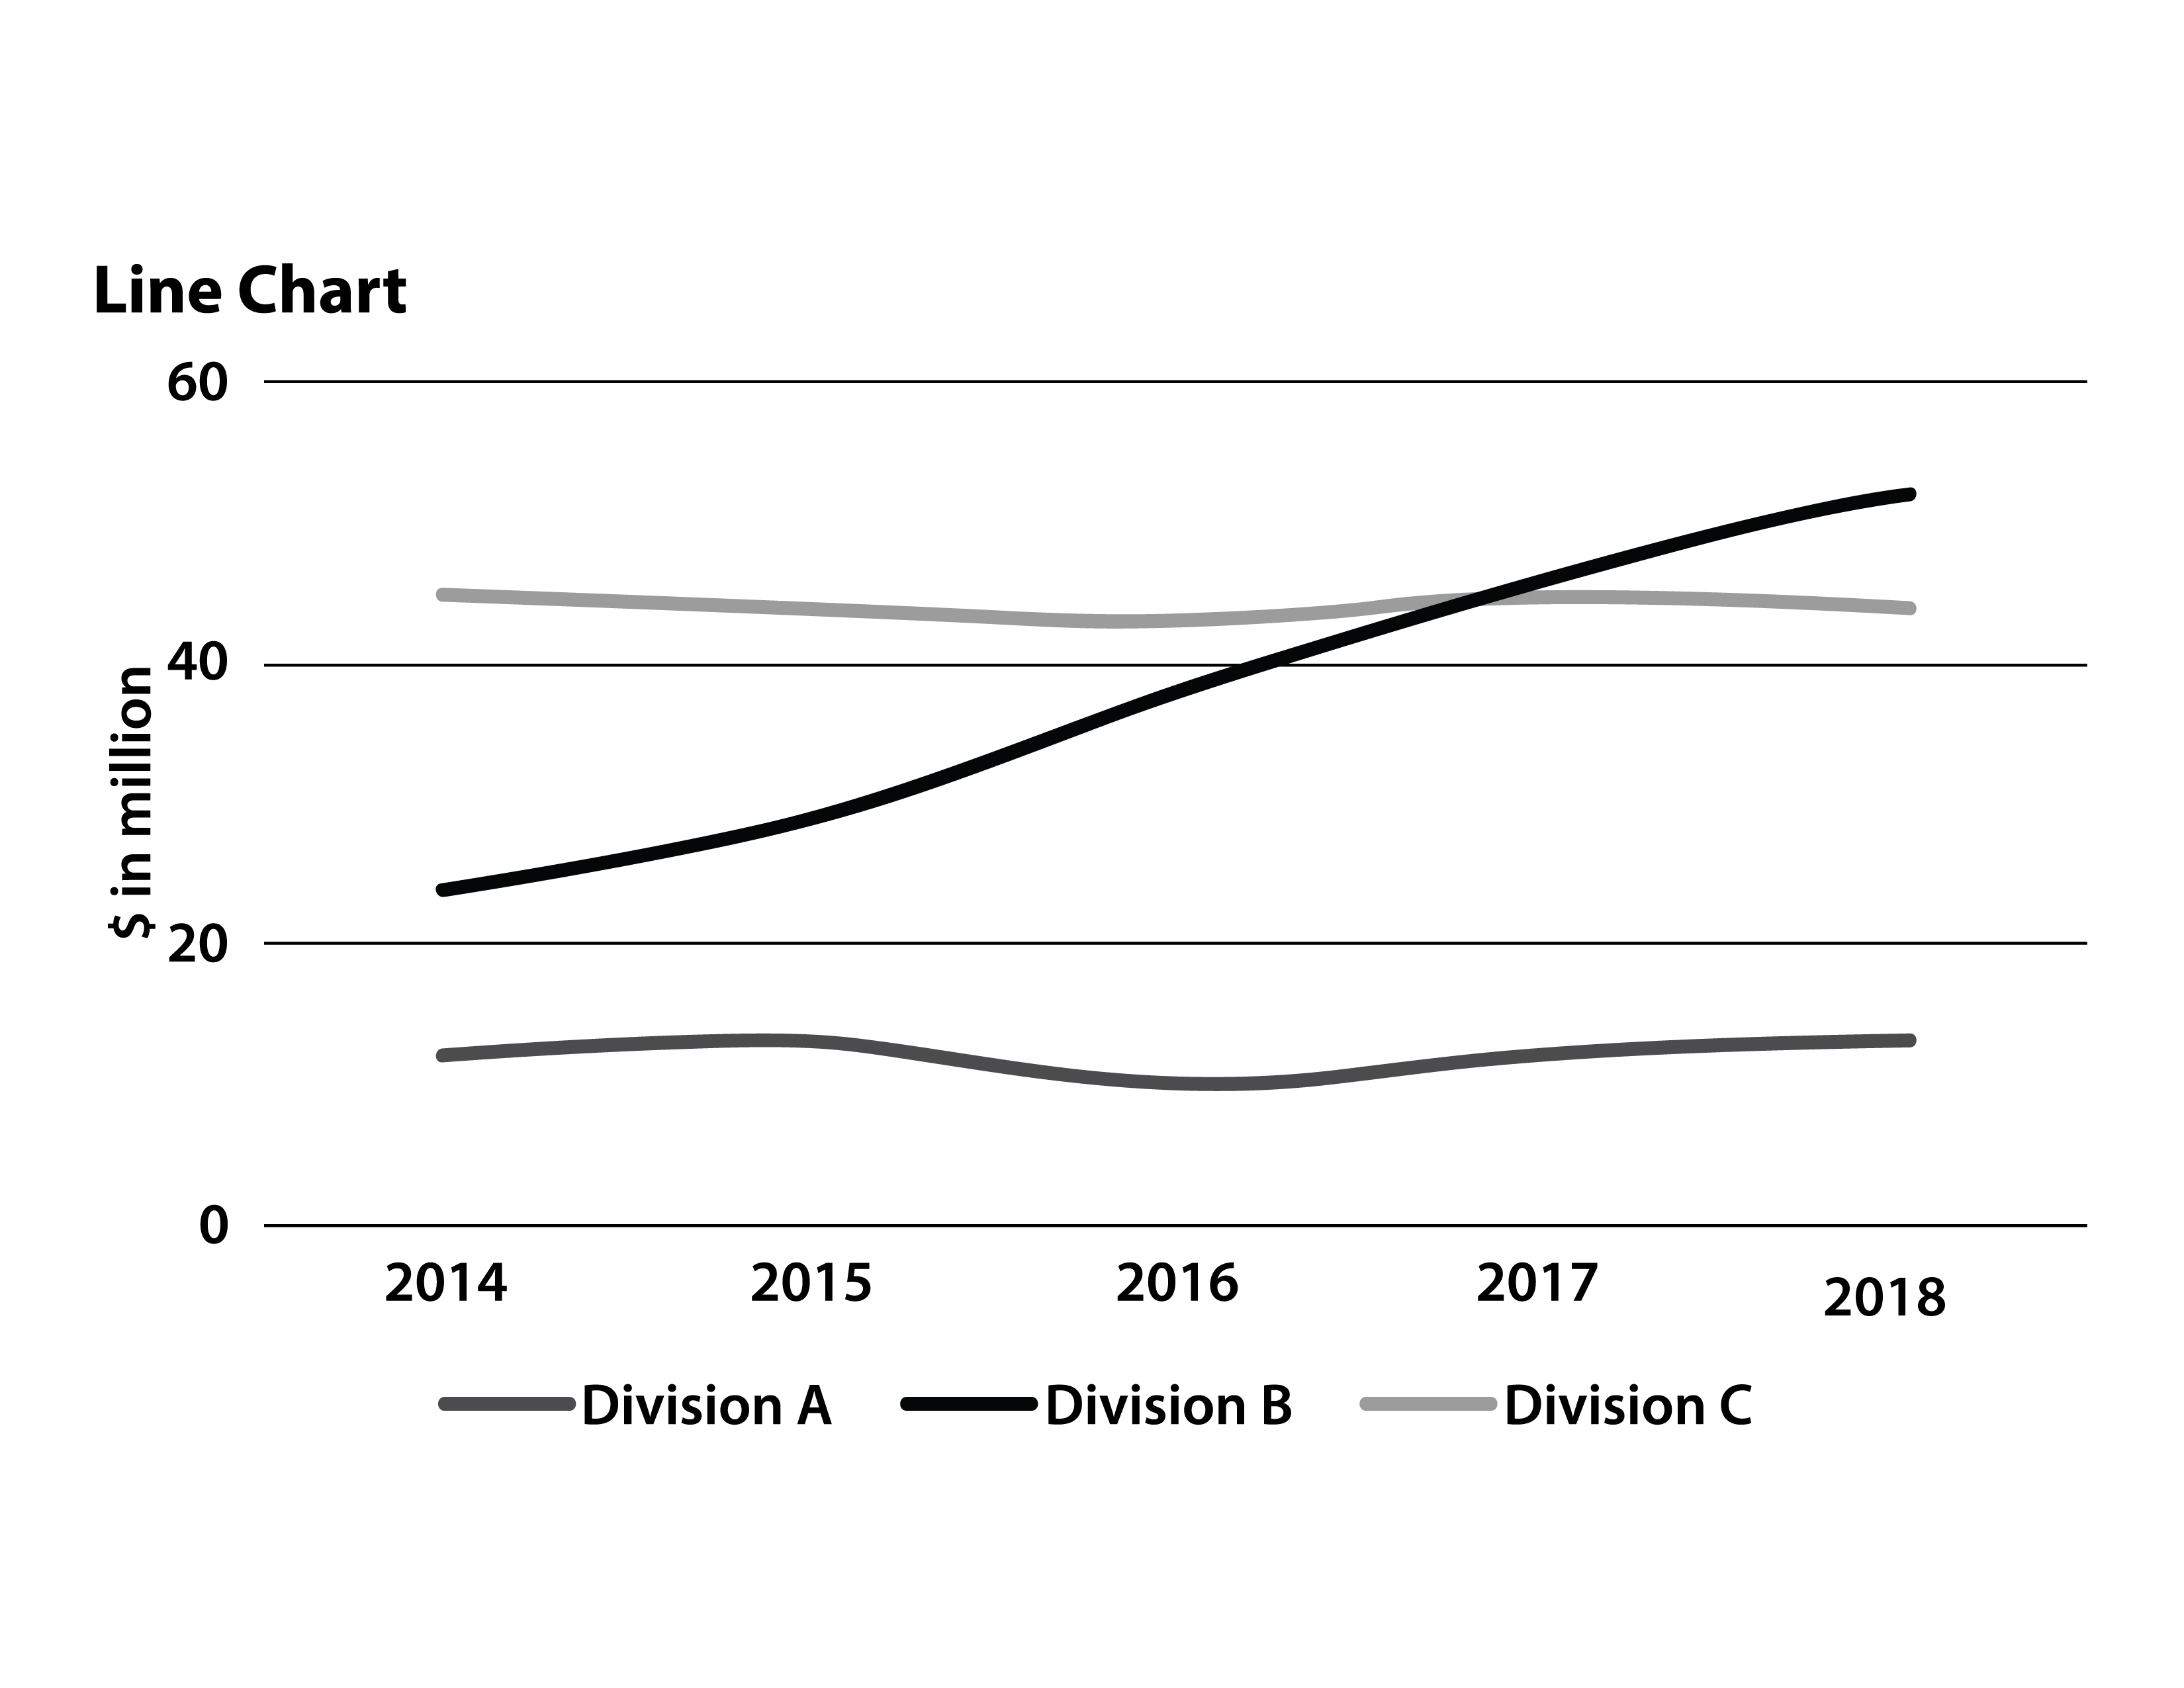
Line Chart (Run Chart)
Reinforcement Learning vs. Supervised Learning
Acceptable vs. Poor Quality Data
