My graph is different why?
I blind the data in date for both data sources (year and month)
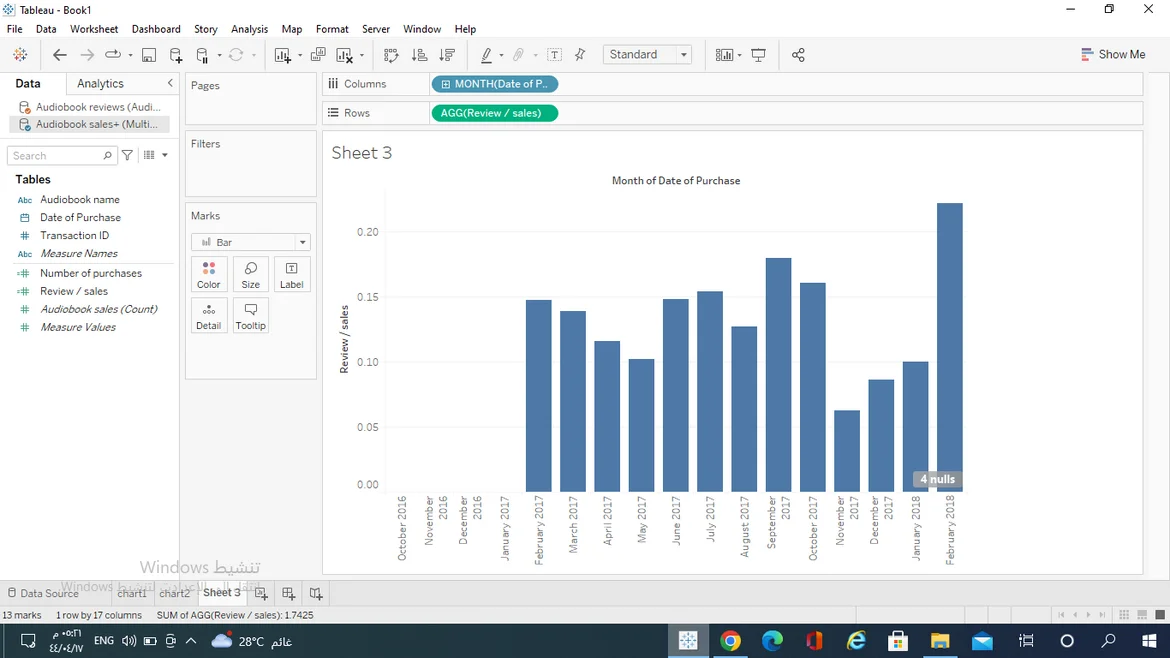
but I got different bar chart
Feb 2018 has the highest ratio
4 answers ( 0 marked as helpful)
I got this graph as well. Can someone assist please? I'm trying to edit the horizontal axis title but I am unable to do so
Go to month and make it continuous
Same is happening with mine.
I have the same problem