Yuvraj S. D.
Before 365:
Student Research Assistant
After 365:
Machine Learning Engineer | PERFACCT GmbH
See all reviews
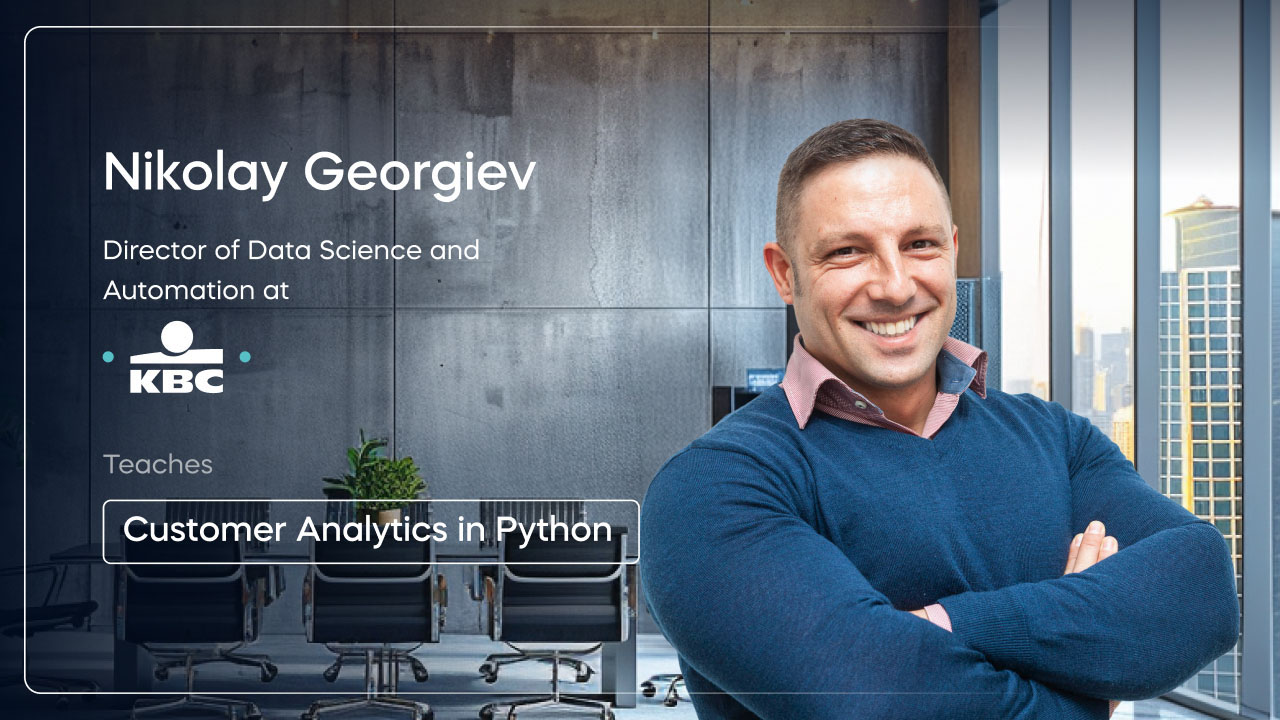
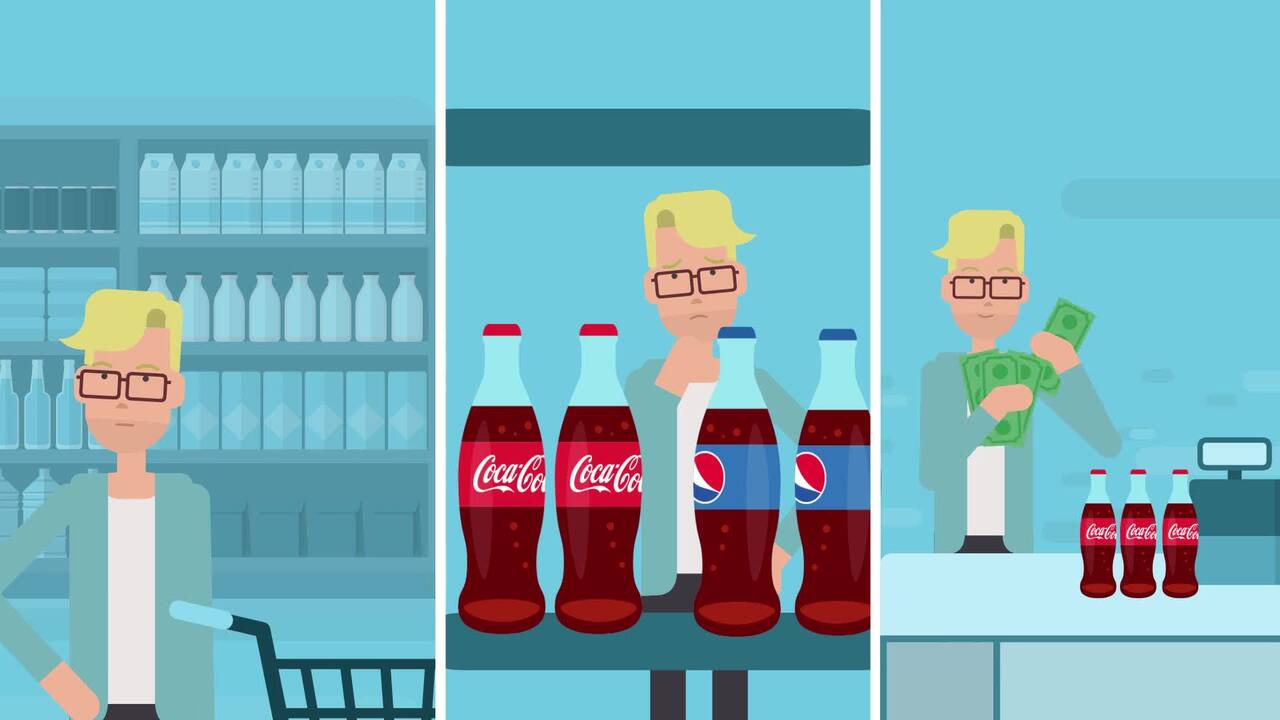
Blend retail marketing understanding with data analytics skills: Master customer segmentation and purchase behaviour modeling in Python


Skill level:
Duration:
CPE credits:
Accredited

Bringing real-world expertise from leading global companies


Doctorate (PhD), Economics & Business Administration


Bringing real-world expertise from leading global companies

Master's degree, Bioinformatics

Description
Curriculum
Free lessons
1.1 Course Introduction
7 min
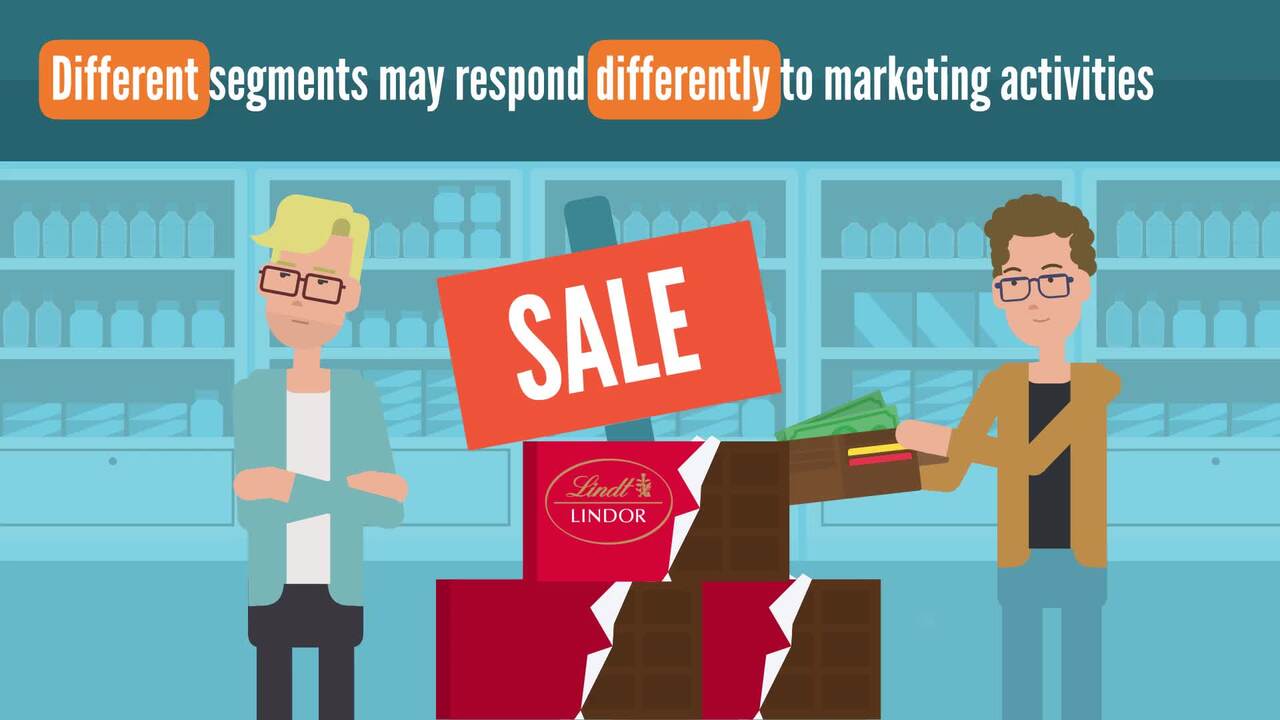
1.2 Segmentation, Targeting, Positioning
7 min
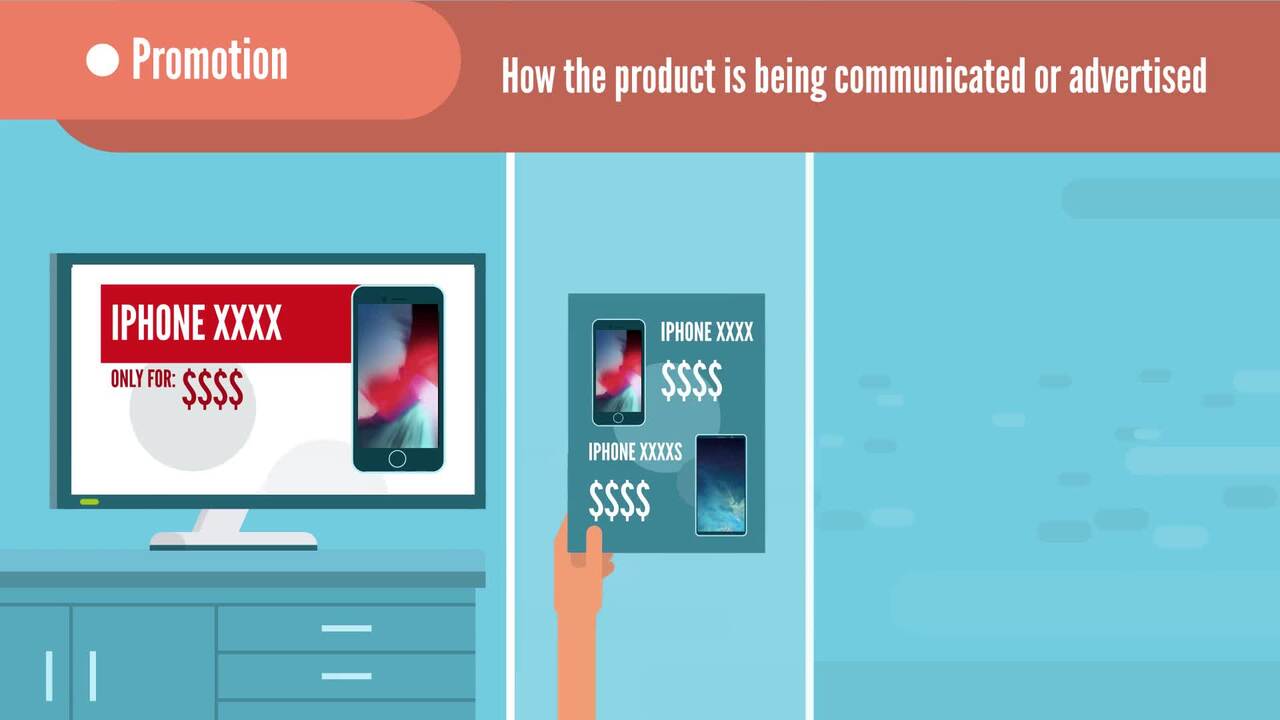
1.3 Marketing Mix
8 min
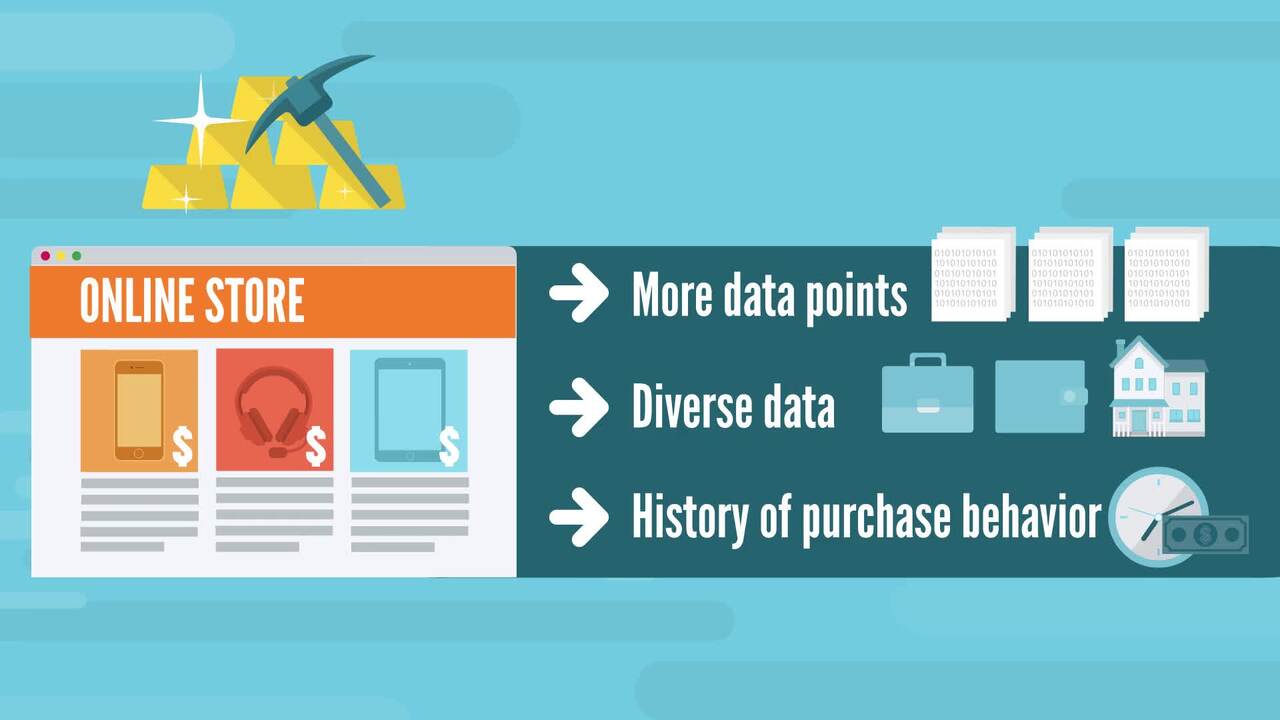
1.4 Physical and Online Retailers: Similarities and Differences.
7 min
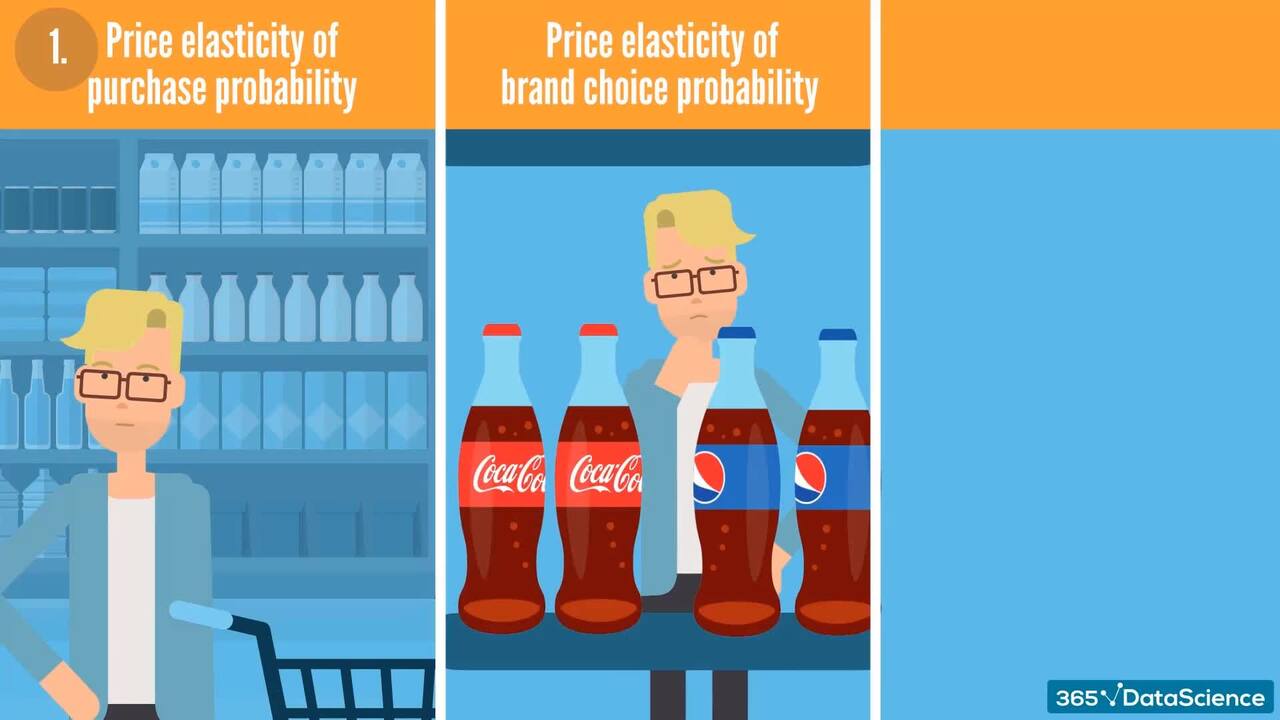
1.5 Price Elasticity
8 min
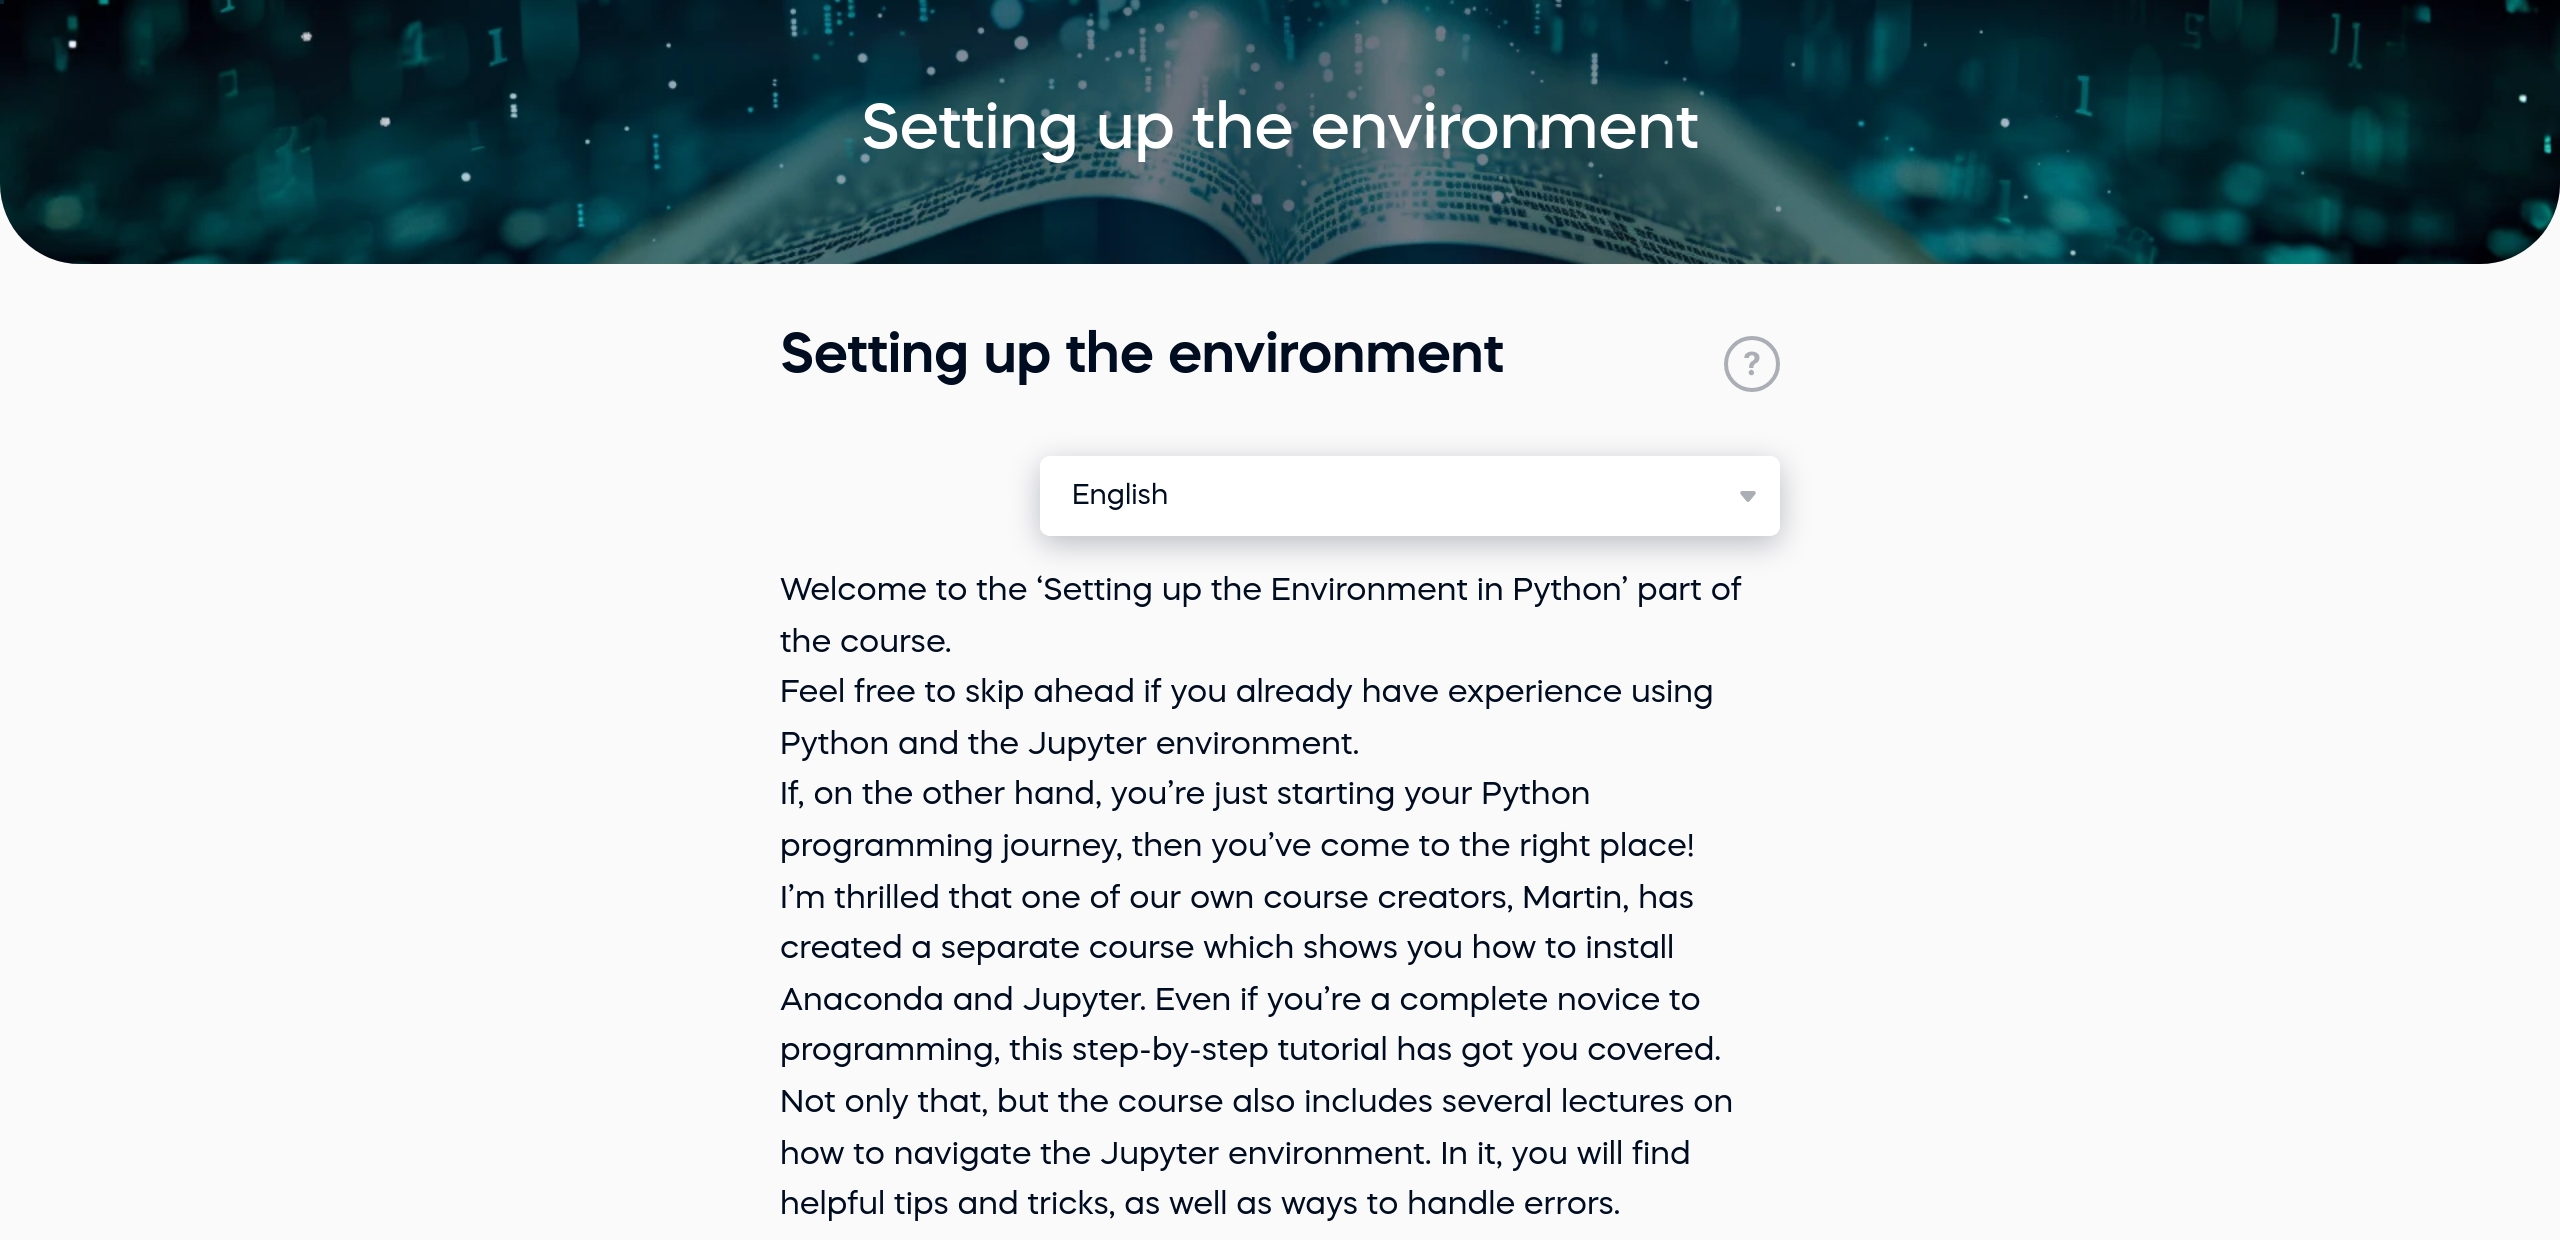
2.1 Setting up the environment
1 min
9 in 10
people walk away career-ready
9 in 10
of our graduates landed a new AI & data job
94%
of AI and data science graduates
successfully change
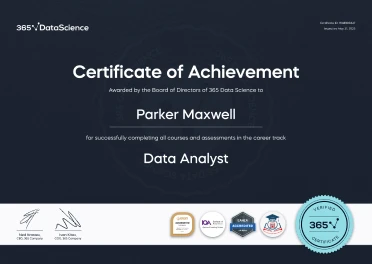
ACCREDITED certificates
Craft a resume and LinkedIn profile you’re proud of—featuring certificates recognized by leading global
institutions.
Earn CPE-accredited credentials that showcase your dedication, growth, and essential skills—the qualities
employers value most.
Certificates are included with the Self-study learning plan.
How it WORKS
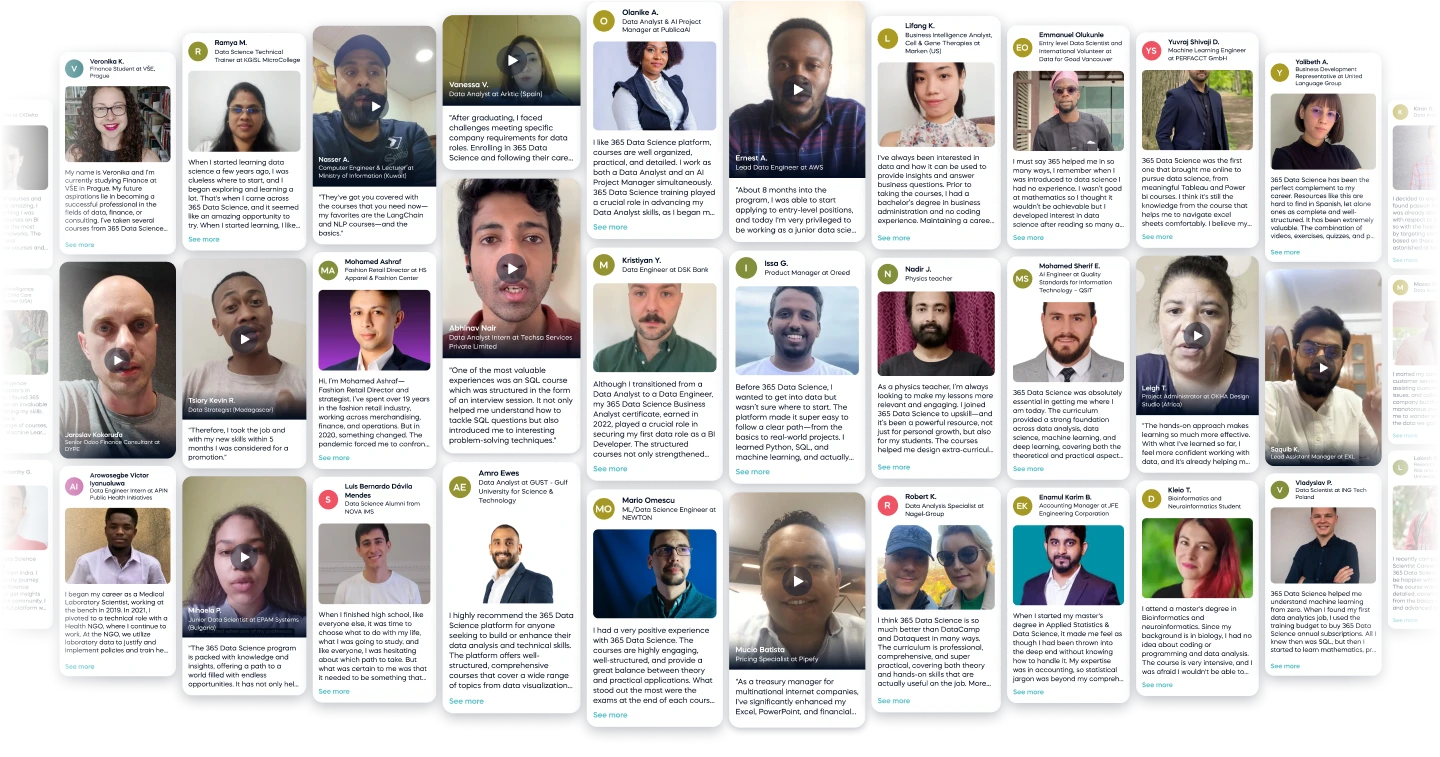
Student REVIEWS