Machine Learning in Python

with Iliya Valchanov
4.8/5
(1,523)

Master advanced statistical techniques and predictive modeling with Python. Acquire the essential skills for aspiring data scientists.

7 hours of content 44308 students

$99.00

Lifetime access

Buy now
14-Day Money-Back Guarantee

What you get:

  • 7 hours of content
  • 94 Interactive exercises
  • 12 Coding exercises
  • 133 Downloadable resources
  • World-class instructor
  • Closed captions
  • Q&A support
  • Future course updates
  • Course exam
  • Certificate of achievement

Machine Learning in Python

A course by Iliya Valchanov

$99.00

Lifetime access

Buy now
14-Day Money-Back Guarantee

What you get:

  • 7 hours of content
  • 94 Interactive exercises
  • 12 Coding exercises
  • 133 Downloadable resources
  • World-class instructor
  • Closed captions
  • Q&A support
  • Future course updates
  • Course exam
  • Certificate of achievement

$99.00

Lifetime access

Buy now

$99.00

Lifetime access

Buy now
14-Day Money-Back Guarantee

What you get:

  • 7 hours of content
  • 94 Interactive exercises
  • 12 Coding exercises
  • 133 Downloadable resources
  • World-class instructor
  • Closed captions
  • Q&A support
  • Future course updates
  • Course exam
  • Certificate of achievement

What You Learn

  • Master foundational machine learning techniques that will take your data analysis skills to the next level
  • Build a strong foundation with in-depth understanding of linear regression and set the stage for advance machine learning models
  • Gain hands-on experience by performing linear regression with sklearn
  • Master logistic regression, a critical analysis tool for binary ML problems
  • Implement K-means clustering and learn how to leverage clustering techniques in a real-world environment
  • Integrate math concepts with hands-on programming skills

Top Choice of Leading Companies Worldwide

Industry leaders and professionals globally rely on this top-rated course to enhance their skills.

Course Description

Machine Learning in Python builds upon the statistical knowledge you gained earlier in the program. This course focuses on predictive modelling and enters multidimensional spaces which require an understanding of mathematical methods, transformations, and distributions. We will introduce these concepts, as well as complex means of analysis such as clustering, factoring, Bayesian inference, and decision theory, while also allowing you to exercise your Python programming skills.

Learn for Free

Course Introduction

1.1 Course Introduction

1 min

The linear regression model

1.3 The linear regression model

6 min

Correlation vs regression

1.5 Correlation vs regression

2 min

Geometrical representation of the Linear Regression Model

1.6 Geometrical representation of the Linear Regression Model

1 min
Setting up the Environment

1.8 Setting up the Environment

1 min

Python packages installation

1.9 Python packages installation

5 min

Curriculum

  • 1. Linear Regression
    23 Lessons 85 Min

    In this part of the course, we will discuss what the course covers, why you need to learn advanced statistics, what’s the differences are with machine learning, and how to get the most out of this training. In this section, you will also expand on what you learned in our statistics training with additional concepts and will apply all the theory in Python. This section serves two purposes: 1) a useful refresher of regression, and 2) a great way to reinforce what you have learned, applying it in practice while coding.

    Course Introduction
    1 min
    The linear regression model
    6 min
    Correlation vs regression
    2 min
    Geometrical representation of the Linear Regression Model
    1 min
    Setting up the Environment Read now
    1 min
    Python packages installation
    5 min
    First regression in Python
    7 min
    Using Seaborn for graphs
    1 min
    How to interpret the regression table
    6 min
    Decomposition of variability
    4 min
    What is the OLS?
    3 min
    R-squared
    6 min
    Multiple linear regression Theory
    3 min
    Adjusted R-squared Theory
    6 min
    F-test
    2 min
    OLS assumptions
    2 min
    A1: Linearity
    2 min
    A2: No endogeneity
    4 min
    A3: Normality and homoscedasticity
    6 min
    A4: No autocorrelation
    4 min
    A5: No multicollinearity
    3 min
    Dealing with categorical data - Dummy variables
    7 min
    Making predictions with the linear regression
    3 min
  • 2. Linear Regression with sklearn
    15 Lessons 57 Min

    While there are many libraries that can compute a regression model, the most numerically stable one is sklearn. It is also the preferred choice of many machine learning professionals. In this section, we implement all we know about regressions in this amazing library.

    What is sklearn
    2 min
    Game plan for sklearn
    2 min
    Simple linear regression
    6 min
    Simple linear regression - summary table
    5 min
    A Note on Normalization Read now
    1 min
    Multiple linear regression
    3 min
    Adjusted R-squared
    5 min
    Feature Selection through p-values
    5 min
    Creating a summary table
    2 min
    A Note on Calculation of P-Values with sklearn Read now
    1 min
    Feature Scaling
    6 min
    Feature Selection through standardization
    5 min
    Making predictions with standardized coefficients
    4 min
    Underfitting and overfitting
    3 min
    Training and testing
    7 min
  • 3. Linear Regression Practical Example
    6 Lessons 38 Min

    An all in one practical example, which will test your understanding of each of the concepts that we have discussed so far. We will focus on a used cars dataset and create a linear regression model to predict the prices of cars. At the end you will have a big assignment where you can dive deep into the optimization of a machine learning model.

    Linear Regression Practical Example (Part 1)
    12 min
    Linear Regression Practical Example (Part 2)
    6 min
    A note on multicollinearity Read now
    1 min
    Linear Regression Practical Example (Part 3)
    3 min
    Linear Regression Practical Example (Part 4)
    8 min
    Linear Regression Practical Example (Part 5)
    8 min
  • 4. Logistic Regression
    11 Lessons 41 Min

    Data scientists use logistic regressions when the dependent variable is binary (0 and 1, true and false, etc.). This type of data is encountered on a daily basis when working as a data scientist, and here, you will learn how to build a logistic regression, understand tables, interpret the coefficients of a logistic regression, calculate the accuracy of the model, as well as how to test. We will introduce under and overfitting, and will teach you how to test your models.

    Introduction to logistic regression
    1 min
    A simple example in Python
    5 min
    Logistic vs logit function
    4 min
    Building a logistic regression
    3 min
    An invaluable coding tip
    2 min
    Understanding the tables
    4 min
    What do the odds actually mean
    5 min
    Binary predictors in a logistic regression
    5 min
    Calculating the accuracy of the model
    3 min
    The concept of overfitting
    4 min
    Testing the model
    5 min
  • 5. Cluster Analysis (Basics and Prerequisites)
    4 Lessons 15 Min

    Cluster analysis is the most intuitive and important example of unsupervised learning. However, to be able to understand cluster analysis, we must first explore the mathematics behind it.

    Introduction to Cluster Analysis
    4 min
    Some examples of clusters
    5 min
    Difference between classification and clustering
    3 min
    Math prerequisites
    3 min
  • 6. K-Means Clustering
    10 Lessons 50 Min

    In this section, you will learn how to do Cluster analysis. Cluster analysis consists in dividing your data into separate groups based on an algorithm. Clustering is an amazing technique often employed in data science. But what’s more, it makes much more sense to study patterns observed in a particular group rather than trying to find patterns in the entire dataset. We will provide several practical examples that will help you understand how to carry out cluster analysis and the difference between classification and clustering.

    K-means clustering
    5 min
    A simple example of clustering
    8 min
    Clustering categorical data
    3 min
    How to choose the number of clusters
    6 min
    Pros and Cons of K-means and clustering
    3 min
    To standardize or to not standardize
    5 min
    Relationship between clustering and regression
    2 min
    Market Segmentation with Cluster Analysis (Part 1)
    6 min
    Market Segmentation with Cluster Analysis (Part 2)
    7 min
    How is clustering useful
    5 min
  • 7. Other Types of Clustering
    3 Lessons 14 Min

    In previous sections, we focus extensively on k-means clustering, as it is the fastest and most efficient method for clustering. In this section, we explore other approaches that are less common.

    Types of clustering
    4 min
    Dendrogram
    5 min
    Heatmaps using Seaborn
    5 min

Topics

machine learningProgrammingPythonTheorydata analysis

Tools & Technologies

python

Course Requirements

  • Highly recommended to take the Intro to Python, Statistics, Math, and Probability courses first
  • You will need to install the Anaconda package, which includes Jupyter Notebook

Who Should Take This Course?

Level of difficulty: Intermediate

  • Aspiring data scientists and ML engineers

Exams and Certification

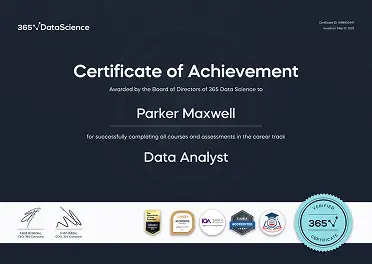
A 365 Data Science Course Certificate is an excellent addition to your LinkedIn profile—demonstrating your expertise and willingness to go the extra mile to accomplish your goals.

Exams and certification

Meet Your Instructor

Iliya Valchanov

Iliya Valchanov

Co-founder at

7 Courses

27213 Reviews

426123 Students

Iliya Valchanov is a co-founder of 365 Data Science and 3veta. He is a Finance graduate with a wide range of expertise in the fields of mathematics, statistics, programming, machine learning, and deep learning. In his courses, Iliya shares his extensive experience in predictive modeling, complex analysis techniques, and optimization algorithms. He has a BA in International Economics, Management and Finance from Bocconi University, where he was Founder and President of the Bocconi Students Mathematics and Logics Association. In 2016, he created his first online course (Statistics) and realized he enjoyed the process of content creation so much that he co-founded 365 Data Science together with a group of friends from university.

What Our Learners Say

08.01.2025
07.01.2025
04.01.2025

365 Data Science Is Featured at

Our top-rated courses are trusted by business worldwide.

Recommended Courses