SQL + Tableau + Python

with Martin Ganchev
4.8/5
(408)

Master the integration of SQL, Python, and Tableau for effective data analysis

5 hours of content 7695 students
Start for free

What you get:

  • 5 hours of content
  • 10 Interactive exercises
  • 32 Downloadable resources
  • World-class instructor
  • Closed captions
  • Q&A support
  • Future course updates
  • Course exam
  • Certificate of achievement

SQL + Tableau + Python

A course by Martin Ganchev
Start for free

What you get:

  • 5 hours of content
  • 10 Interactive exercises
  • 32 Downloadable resources
  • World-class instructor
  • Closed captions
  • Q&A support
  • Future course updates
  • Course exam
  • Certificate of achievement
Start for free

What you get:

  • 5 hours of content
  • 10 Interactive exercises
  • 32 Downloadable resources
  • World-class instructor
  • Closed captions
  • Q&A support
  • Future course updates
  • Course exam
  • Certificate of achievement

What You Learn

  • Master the integration of SQL, Python, and Tableau for effective data analysis
  • Use SQL, Tableau, and Python to respond to real-life business questions
  • Learn how to seamlessly transfer data from Python to SQL, creating the structure necessary for connecting two compatible software tools
  • Gain hands-on experience with Tableau to create compelling data visualizations and impactful analysis
  • Apply machine learning techniques to solve specific business problems
  • Enhance your resume with three essential tech stack components for aspiring data analysts

Top Choice of Leading Companies Worldwide

Industry leaders and professionals globally rely on this top-rated course to enhance their skills.

Course Description

While Python is the leading programming language for data science, SQL is unmatched when it comes to relational database management. Tableau, on the other hand, is a leading business intelligence software, providing tools for quick computations and rich visualizations. This course will show you how to combine these software products to solve real-life business problems.

Learn for Free

Course Introduction

1.1 Course Introduction

3 min

Properties and Definitions: Data, Servers, Clients, Requests, and Responses

1.2 Properties and Definitions: Data, Servers, Clients, Requests, and Responses

5 min

Properties and Definitions: Data Connectivity, APIs, and Endpoint

1.3 Properties and Definitions: Data Connectivity, APIs, and Endpoint

7 min

Further Details on APIs

1.4 Further Details on APIs

8 min

Text Files as Means of Communication

1.5 Text Files as Means of Communication

4 min

Definitions and Applications

1.6 Definitions and Applications

5 min

Curriculum

  • 1. Software Integration
    6 Lessons 32 Min

    We begin by introducing key terms, such as data, servers, clients, requests, responses, data connectivity, APIs, and endpoints. Understanding all of these terms and how they are used is crucial for grasping the concept of software integration.

    Course Introduction
    3 min
    Properties and Definitions: Data, Servers, Clients, Requests, and Responses
    5 min
    Properties and Definitions: Data Connectivity, APIs, and Endpoint
    7 min
    Further Details on APIs
    8 min
    Text Files as Means of Communication
    4 min
    Definitions and Applications
    5 min
  • 2. What's Next in the Course?
    3 Lessons 10 Min

    In this short section, we introduce the business problem to be solved and outline the task we’ll need to solve in the lessons to come: predict the probability that an individual will be absent from work on a specific day.

    Up Ahead
    4 min
    Real-Life Example: Absenteeism at Work
    3 min
    Real-Life Example: The Dataset
    3 min
  • 3. Preprocessing the 'Absenteeism_data'
    23 Lessons 94 Min

    In this section, we will focus on cleaning and preprocessing an entire dataset. If you already are a Python guru and cleaning data sets comes as a second nature, you may wish to skip this section. But if it is possible that you have gaps in your Python mastery, even if it’s here and there, it is essential that you go through every lecture. We are actually coding all the time in this section, so you’ll quite likely end up having a lot of fun.

    What to Expect from the Next Couple of Sections Read now
    3 min
    importing the Dataset in Python
    3 min
    Eyeballing the Data
    6 min
    Introduction to Terms with Multiple Meanings
    3 min
    A Refresher on Regression Analysis Read now
    3 min
    An Analytical Approach to Solving the Task
    2 min
    Dropping the "ID" Column
    6 min
    Analysis of the "Reason for Absence" Column
    5 min
    Converting a Feature into Multiple Dummy Variables
    9 min
    Dropping a Dummy Variable Read now
    3 min
    Working with Dummy Variables from a Statistical Perspective
    1 min
    Grouping the Various Reasons for Absence
    9 min
    Concatenating Column Values
    5 min
    Reordering Columns
    2 min
    Creating Checkpoints in Jupyter
    3 min
    Working on the "Date" Column
    8 min
    Extracting the Month Value
    7 min
    Creating the "Day of the Week" Column
    4 min
    Dropping the "Date" Column Read now
    1 min
    Modifying "Education" and Discussing "Children" and "Pets"
    5 min
    Analyzing the Next 5 Columns in our DataFrame
    3 min
    Final Remarks on the Data Preprocessing Part of the Exercise
    2 min
    A Note on Exporting Your Data as a *.csv File Read now
    1 min
  • 4. Machine Learning
    15 Lessons 67 Min

    This section is at the core of this Absenteeism Exercise. Here, we discuss modern machine learning tools that can be used to solve problems like the one we’re looking at. Every step requires you to use Python, so stretch your coding fingers and let’s get to it!

    Exploring the Problem from a Machine Learning Point of View
    3 min
    Creating the Targets for the Logistic Regression
    7 min
    Selecting the Inputs for the Regression
    3 min
    Standardizing the Dataset for Better Results
    3 min
    Train-test Split of the Data
    6 min
    Training and Evaluating the Model
    6 min
    Extracting the Intercept and Coefficients
    5 min
    Interpreting the Coefficients
    6 min
    Creating a Custom Scaler to Standardize Only Numerical Features
    4 min
    Interpreting the Important Predictors
    5 min
    Simplifying the Model (Backward Elimination)
    4 min
    Testing the Machine Learning Model
    5 min
    Saving theLogistic Regression Model
    4 min
    More about 'pickling' Read now
    2 min
    Creating a Module for Later Use of the Model
    4 min
  • 5. Connecting Python and SQL
    11 Lessons 47 Min

    In this section, you see software integration applied in practice. You will not only be given the chance to experience how data can be transferred from Python to SQL firsthand, but you will also learn about the structure necessary for connecting two compatible software tools. Finally, we will export the dataset in the form of a *.csv file that’s ready to be used in Tableau.

    Downloading the Section Resources Read now
    1 min
    Loading the "abssenteeism_module"
    4 min
    Working with the "absenteeism_module"
    6 min
    Creating a Database Structure in MySQL
    6 min
    Installing and Importing 'pymysql'
    3 min
    Setting up a Connection and Creating a Cursor
    3 min
    Creating the 'predicted_outputs' table in MySQL
    5 min
    Executing and SQL Query from Python
    3 min
    Moving Data from Python to SQL - Part I
    6 min
    Moving Data from Python to SQL - Part II
    7 min
    Moving Data from Python to SQL - Part III
    3 min
  • 6. Analyzing the Obtained Data in Tableau
    4 Lessons 24 Min

    In the last section of this course, we focus on the analytical part of the absenteeism task. We will load, analyze, and visualize in Tableau the data obtained in the previous sections.

    Tableau Analysis: Age vs Probability - Homework and Dataset Read now
    1 min
    Tableau Analysis: Age vs Probability
    9 min
    Tableau Analysis: Reasons vs Probability
    8 min
    Tableau Analysis: Transportation Expense vs Probability
    6 min

Topics

Pythondata analysisTableauProgrammingData processingmachine learningTheorydata visualizationSQL

Tools & Technologies

python
tableau
theory
sql

Course Requirements

  • A solid understanding of relational database theory and basic SQL is required. It is highly recommended to start with the SQL course first
  • An introduction to Tableau is strongly recommended
  • An introduction to Machine Learning in Python is strongly recommended
  • You will need to install MySQL Workbench
  • You will need to install Tableau Public

Who Should Take This Course?

Level of difficulty: Advanced

  • Aspiring data analysts, data scientists, data engineers who want to improve their job prospects
  • Existing data analysts, data scientists, data engineers who want to become proficient in SQL, Tableau, and Python

Exams and Certification

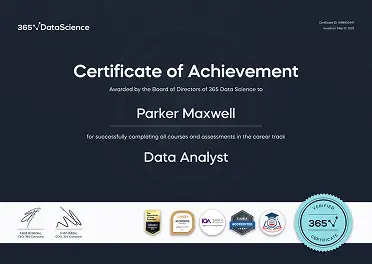
A 365 Data Science Course Certificate is an excellent addition to your LinkedIn profile—demonstrating your expertise and willingness to go the extra mile to accomplish your goals.

Exams and certification

Meet Your Instructor

Martin Ganchev

Martin Ganchev

Worked at

15 Courses

34025 Reviews

508655 Students

Martin began working with 365 in 2016 as the company’s second employee. Martin’s resilience, hard-working attitude, attention to detail, and excellent teaching style played an instrumental role in 365’s early days. He authored some of the firm’s most successful courses. And besides teaching, Martin dreams about becoming an actor. In September 2021, he enrolled in an acting school in Paris, France.

What Our Learners Say

17.11.2024
17.11.2024
Good course

365 Data Science Is Featured at

Our top-rated courses are trusted by business worldwide.