Statistics puts the “scientist” in data scientist.
It is the driving force in any quantitative career, providing the foundational skills necessary for data analysis.
This is the perfect statistics course that will help you understand how to design statistical tests and analyse data using modern software packages and programming languages. We start from the very basics and gradually build your statistical thinking. This foundational knowledge prepares you to tackle increasingly complex topics as you advance in your data journey.
Don’t spend hundreds of hours reading textbooks and trying to learn statistics on your own. It doesn’t get any better if you rely on statistics tutorials from YouTube. Our course is the perfect tool to acquire invaluable knowledge that will make statistics easy for you. The step-by-step tutorials we have prepared alongside interactive exercises with statistical formulas and symbols will help you master statistics in several hours. This Statistics course stands out because it gives easy to understand practical examples and allows you to test what you have learned after each lesson. This formula has proven extremely successful as hundreds of thousands of users around the world have chosen this course to learn statistics and have expressed their satisfaction.
This statistics course is suitable for university students who need statistics for their studies. It is also highly recommended for graduates and young professionals who want to improve their quantitative skills. Even if you lack any quantitative skills and haven’t learned statistics before, don’t worry. This intro to statistics course is designed to guide you from the ground up.
There are hundreds of Statistics courses on the internet, but this is one of the most popular ones. The course instructor Iliya Valchanov teaches statistics for data science and business in a friendly way that is easy to understand and the interactive exercises throughout the course allow you to reinforce what you have learned. At the end of all major sections of the Statistics course, the author will solve a practical case study alongside you, helping you understand how to apply in practice the concepts you have just learned in the lessons.
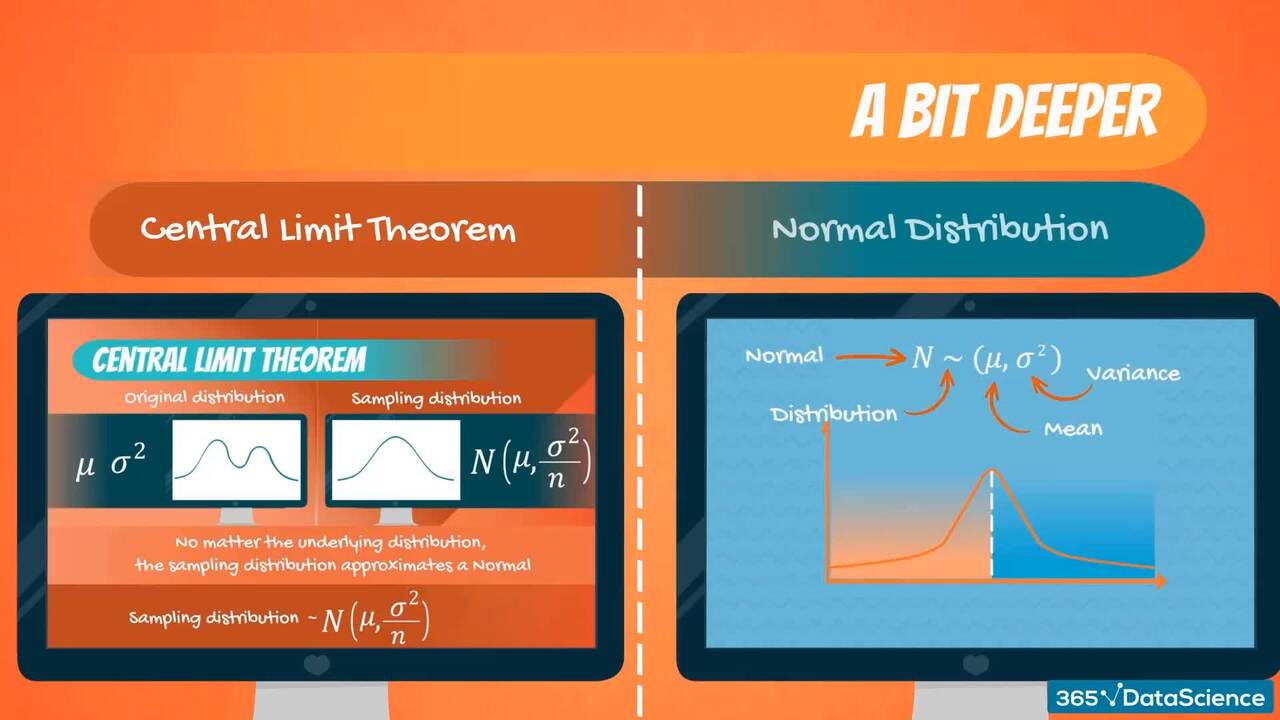
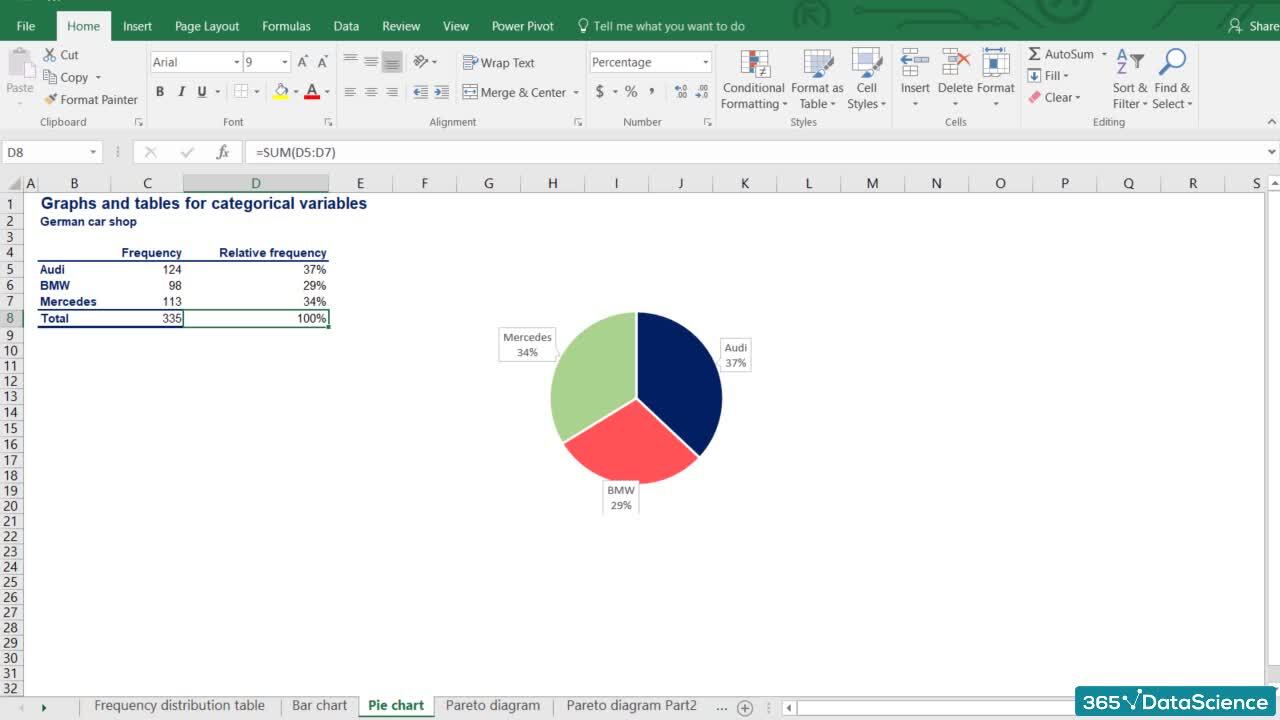
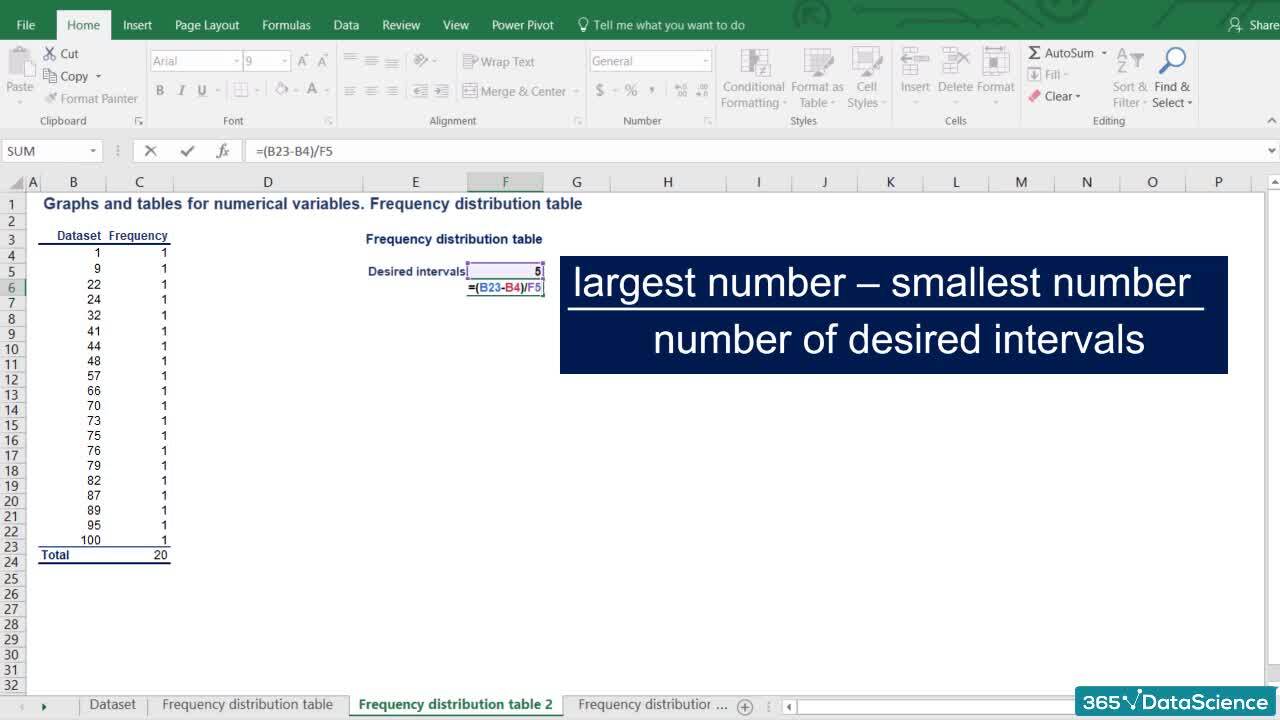
Join us on a journey that will introduce you to the different types of data, the measures of central tendency, and data variability. Gain the quant skills to use inferential statistics and work with the normal distribution. Calculate confidence intervals and perform hypothesis tests to get an introduction to the core principles of data-driven decision-making.
How is this online Statistics course different than the rest?
1. Content quality
Experience structured learning with a step-by-step approach. Our key strength lies in making complex topics accessible and easy to understand. It can’t be overstated how important is to make the course lectures and your entire learning journey fun and exciting.
The instructor does not simply introduce you to statistics theory and rules, they effectively demonstrate how to apply statistics in practical scenarios. By leveraging compelling storytelling and drawing on real-world experiences, they ensure that you gain a solid understanding of the subject.
2. One of the most popular Statistics courses online
This statistics training is a definite bestseller in the field and has been taken by hundreds of thousands of students around the world. This means that if you choose to learn with us, you will be in good hands.
3. Downloadable materials
Gain access to valuable statistics templates you can use as a reference at any point of your career. In addition, the course comes with a full set of downloadable materials – complete statistics course notes, flashcards with key terms, practice exercises, course exams – everything is included inside.
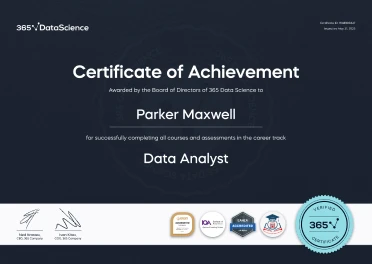
4. Certificate of achievement
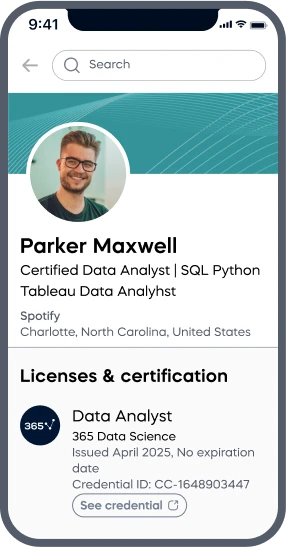
If you compete the Statistics course and pass successfully its course exam, you will be awarded a verifiable certificate of achievement, which is a testament to your dedication and hard work.
Click the ‘Buy now’ button and start this amazing learning journey today! Make an investment to acquire quant skills that could change your entire career.
Prerequisites
-
Microsoft Excel (any recent version, such as Excel 2019, 2021, or Microsoft 365)
-
No prior knowledge of statistics is required.