Online Course
Time Series Analysis with Python

Master time series forecasting in Python: Gain solid theoretical knowledge and work with popular time series models such as ARIMA, ARCH, and GARCH

4.8

863 reviews on
12,869 students already enrolled
  • Institute of Analytics
  • The Association of Data Scientists
  • E-Learning Quality Network
  • European Agency for Higher Education and Accreditation
  • Global Association of Online Trainers and Examiners

Skill level:

Intermediate

Duration:

7 hours
  • Lessons (7 hours)

CPE credits:

11
CPE stands for Continuing Professional Education and represents the mandatory credits a wide range of professionals must earn to maintain their licenses and stay current with regulations and best practices. One CPE credit typically equals 50 minutes of learning. For more details, visit NASBA's official website: www.nasbaregistry.org

Accredited

certificate

What you learn

  • Employ proven time series techniques to make reliable forecasts.
  • Master manual model selection principles.
  • Normalize data to compare and analyze different time series datasets.
  • Apply AR, MA, ARMA, ARIMA, ARCH, and GARCH models in Python.
  • Visualize time series types like white noise and random walk.

Topics & tools

TheoryPythonProgrammingData AnalysisData ProcessingTime SeriesForecastingMachine and Deep Learning

Your instructor

Course OVERVIEW

Description

CPE Credits: 11 Field of Study: Information Technology
Delivery Method: QAS Self Study
Data Science mainly relies on working with two types of data - cross-sectional and time series. This course will help you master the latter by introducing you to the ARMA, seasonal, integrated, MAX and volatility models, as well as show you how to forecast them into the future

Prerequisites

  • Python (version 3.8 or later), pandas library, and a code editor or IDE (e.g., Jupyter Notebook, Spyder, or VS Code)
  • Basic familiarity with Python programming is required.
  • Familiarity with NumPy is helpful but not mandatory.

Curriculum

89 lessons 64 exercises 1 exam
  • 1. Introduction
    4 min
    In this short section, we’ll tell you a bit more of what the course is about, how its structured and what our goal is.
    4 min
    In this short section, we’ll tell you a bit more of what the course is about, how its structured and what our goal is.
    What does the Course Cover Free
  • 2. Setting Up the Environment
    2 min
    In this part of the course, we will explain to you how to set up Python 3 and then load up Jupyter. We’ll also show you what the Anaconda Prompt is and how we use it to download and import new modules.
    2 min
    In this part of the course, we will explain to you how to set up Python 3 and then load up Jupyter. We’ll also show you what the Anaconda Prompt is and how we use it to download and import new modules.
    Setting up the Environment Free
    Installing the Necessary Packages Free
  • 3. Introduction to Time Series in Python
    24 min
    In this section of the course, we are going to learn what makes a dataset a time series, and discuss what separates it from cross-sectional data. We’ll introduce the appropriate mathematical notation for such data before loading up a dataset and quickly examining it.
    24 min
    In this section of the course, we are going to learn what makes a dataset a time series, and discuss what separates it from cross-sectional data. We’ll introduce the appropriate mathematical notation for such data before loading up a dataset and quickly examining it.
    Introduction to Time Series Data Free
    Exercise Free
    Notation for Time Series Data Free
    Exercise Free
    Peculiarities of Time Series Data Free
    Exercise Free
    Loading the Data Free
    Exercise Free
    Examining the Data Free
    Exercise Free
    Plotting the Data Free
    Exercise Free
    The QQ Plot Free
    Exercise Free
  • 4. Creating a Time Series Object in Python
    26 min
    In this section of the course, we will go through the pre-processing aspects of working with time series. We’ll see how to interpret string text as dates and set these dates as indices of the data set. We’ll then set a fixed frequency and account for any missing values before splitting up the set for training and testing. In the appendix, we’ll show you how to import data directly from Yahoo Finance, so you can conduct your own analysis after completing the course.
    Transforming String Inputs into Date Time Values
    Exercise
    Using Dates as Indices
    Exercise
    Setting the Frequency
    Exercise
    Filling Missing Values
    Exercise
    Adding and Removing Columns in a Data Frame
    Exercise
    Splitting the Data
    Exercise
    Updating the Dataset
  • 5. Working with Time Series in Python
    40 min
    In this section of the course, we’ll examine and visualize some important types of time series, like white noise and a random walk. We’ll then discuss important concepts like stationarity, seasonality and autocorrelation, before exploring the ACF and PACF of a S&P 500’s prices.
    40 min
    In this section of the course, we’ll examine and visualize some important types of time series, like white noise and a random walk. We’ll then discuss important concepts like stationarity, seasonality and autocorrelation, before exploring the ACF and PACF of a S&P 500’s prices.
    White Noise
    Exercise
    Random Walk
    Exercise
    Stationarity
    Exercise
    Determining Weak Form Stationarity
    Exercise
    Seasonality
    Exercise
    Correlation Between Past and Present Values
    Exercise
    The ACF
    Exercise
    The PACF
    Exercise
  • 6. Picking the Correct Model
    3 min
    In this short section, we’ll discuss the general rules of manual model selection. We will talk about which models we prefer, what we want to avoid and how to decide between models. We’ll talk about the Log-likelihood and information criterion as measurements of preference among similar models.
    Picking the Correct Model
    Exercise
  • 7. The AR Model
    54 min
    In this section, we’ll introduce the Autoregressive Model and see how well it models market index prices and returns. We’ll discuss how to use the PACF to determine the appropriate number of lags for the model and explore the concept of normalizing values and its impact on model selection.
    The AR Model
    Exercise
    Examining the ACF and PACF of Prices
    Exercise
    Fitting an AR(1) Model for Index Prices
    Exercise
    Fitting Higher-Lag AR Models for Prices
    Exercise
    Using Returns
    Exercise
    Examining the ACF and PACF of Returns
    Exercise
    Fitting an AR(1) Model for Returns
    Exercise
    Fitting Higher-Lag AR Models for Returns
    Exercise
    Normalizing Values
    Exercise
    Model Selection for Normalized Returns (AR Model)
    Exercise
    Examining the AR Model Residuals
    Exercise
    Unexpected Shocks from Past Periods
  • 8. The MA Model
    34 min
    In this section, we’ll introduce the Moving Average model and see how well it describes price returns. We’ll also have a look at how the MA model performs when dealing with non-stationary data and comment on the mathematical arguments for and against using such models for index prices.
    The MA Model
    Exercise
    Fitting an MA(1) Model for Returns
    Exercise
    Fitting Higher-Lag MA Models for Returns
    Exercise
    Examining the MA Model Residuals for Returns
    Exercise
    Model Selection for Normalized Returns (MA Model)
    Exercise
    Fitting an MA(1) Model for Prices
    Exercise
    Past Values and Past Errors
  • 9. The ARMA Model
    41 min
    In this section, we’ll combine the two models we just examined – the AR and MA – into one: the ARMA. We’ll examine how they synergize and limit the drawbacks each model has on its own. We’ll then talk about the issues that come along with finding the best-fitting ARMA model and see how checking the model residuals can be beneficial in model selection.
    The ARMA Model
    Exercise
    Fitting a Simple ARMA Model for Returns
    Exercise
    Fitting Higher-Lag ARMA Models for Returns - Part 1
    Fitting Higher-Lag ARMA Models for Returns - Part 2
    Fitting Higher-Lag ARMA Models for Returns - Part 3
    Exercise
    Examining the ARMA Model Residuals of Returns
    Exercise
    ARMA for Prices
    Exercise
    ARMA Models and Non-Stationary Data
  • 10. The ARIMA Model
    45 min
    In this section of the course, we’ll talk about “integration” and integrated models. We’ll explain why and when we use them, as well as when we should avoid them. Here, we’ll also briefly explain the idea of “MAX” models and how to add exogenous variables to any time series model.
    45 min
    In this section of the course, we’ll talk about “integration” and integrated models. We’ll explain why and when we use them, as well as when we should avoid them. Here, we’ll also briefly explain the idea of “MAX” models and how to add exogenous variables to any time series model.
    The ARIMA Model
    Exercise
    Fitting a Simple ARIMA Model for Prices
    Exercise
    Fitting Higher-Lag ARIMA Models for Prices - Part 1
    Fitting Higher-Lag ARIMA Models for Prices - Part 2
    Exercise
    Higher Levels of Integration
    Exercise
    Using ARIMA Models for Returns
    Exercise
    Outside Factors and the ARIMAX Model
    Exercise
    Seasonal Models - SARIMAX
    Predicting Stability
  • 11. The ARCH Model
    34 min
    In this section, we’ll talk about the idea of measuring volatility when we’re looking for stability in our investments. We’ll explain the multiple layers of ARCH models and how they differ from the ARMA family of models we just examined. We’ll spend some time discussing the vast functionality of the “arch_model” method and why it’s important to know the default values for many of its arguments.
    The ARCH Model
    Exercise
    Volatility
    Exercise
    A More Detailed Look of the ARCH Model
    Exercise
    The arhc_model Method
    Exercise
    The Simple ARCH Model
    Higher-Lag ARCH Models
    Exercise
    An ARMA Equivalent of the ARCH Model
  • 12. The GARCH Model
    13 min
    In this section of the course, we’ll discuss the generalized version of the ARCH model, also known as the GARCH. We’ll explore why this model is more widely used, how it outperforms high-order ARCH models and why it looks so similar to the ARMA. We’ll then empirically test the known fact that the GARCH(1,1) is the best model for measuring the volatility of price returns.
    The GARCH Model
    Exercise
    The ARMA and the GARCH
    Exercise
    The Simple GARCH Model
    Exercise
    Higher-Lag GARCH Models
    Exercise
    An Alternative to the Model Selection Process
  • 13. Auto ARIMA
    28 min
    In this section of the course, we’ll automate the model selection process with the help of the AUTO ARIMA package.
    28 min
    In this section of the course, we’ll automate the model selection process with the help of the AUTO ARIMA package.
    Auto ARIMA
    Preparing Python for Model Selection
    The Default Best Fit
    Basic Auto ARIMA Arguments
    Advanced Auto ARIMA Arguments
    The Goal Behind Modelling
  • 14. Time Series Forecasting
    46 min
    In this section of the course, we will make forecasts about the future based on the simple models we have introduced so far.
    46 min
    In this section of the course, we will make forecasts about the future based on the simple models we have introduced so far.
    Introduction to Time Series Forecasting
    Simple Forecasting Returns with AR and MA
    Intermediate (MAX Model) Forecasting
    Advanced (Seasonal) Forecasting
    Auto ARIMA Forecasting
    Pitfalls of Forecasting
    Forecasting Volatility
    Appendix: Multivariate Forecasting (VARMAX)
  • 15. Business Case
    28 min
    In this final part of the course, we will examine how a real-life event like the Dieselgate scandal can alter the trends in time series data.
    28 min
    In this final part of the course, we will examine how a real-life event like the Dieselgate scandal can alter the trends in time series data.
    Business Case - A Look Into the Automobile Industry
  • 16. Course exam
    15 min
    15 min
    Course exam

Free lessons

What does the Course Cover

1.1 What does the Course Cover

4 min

Setting up the Environment

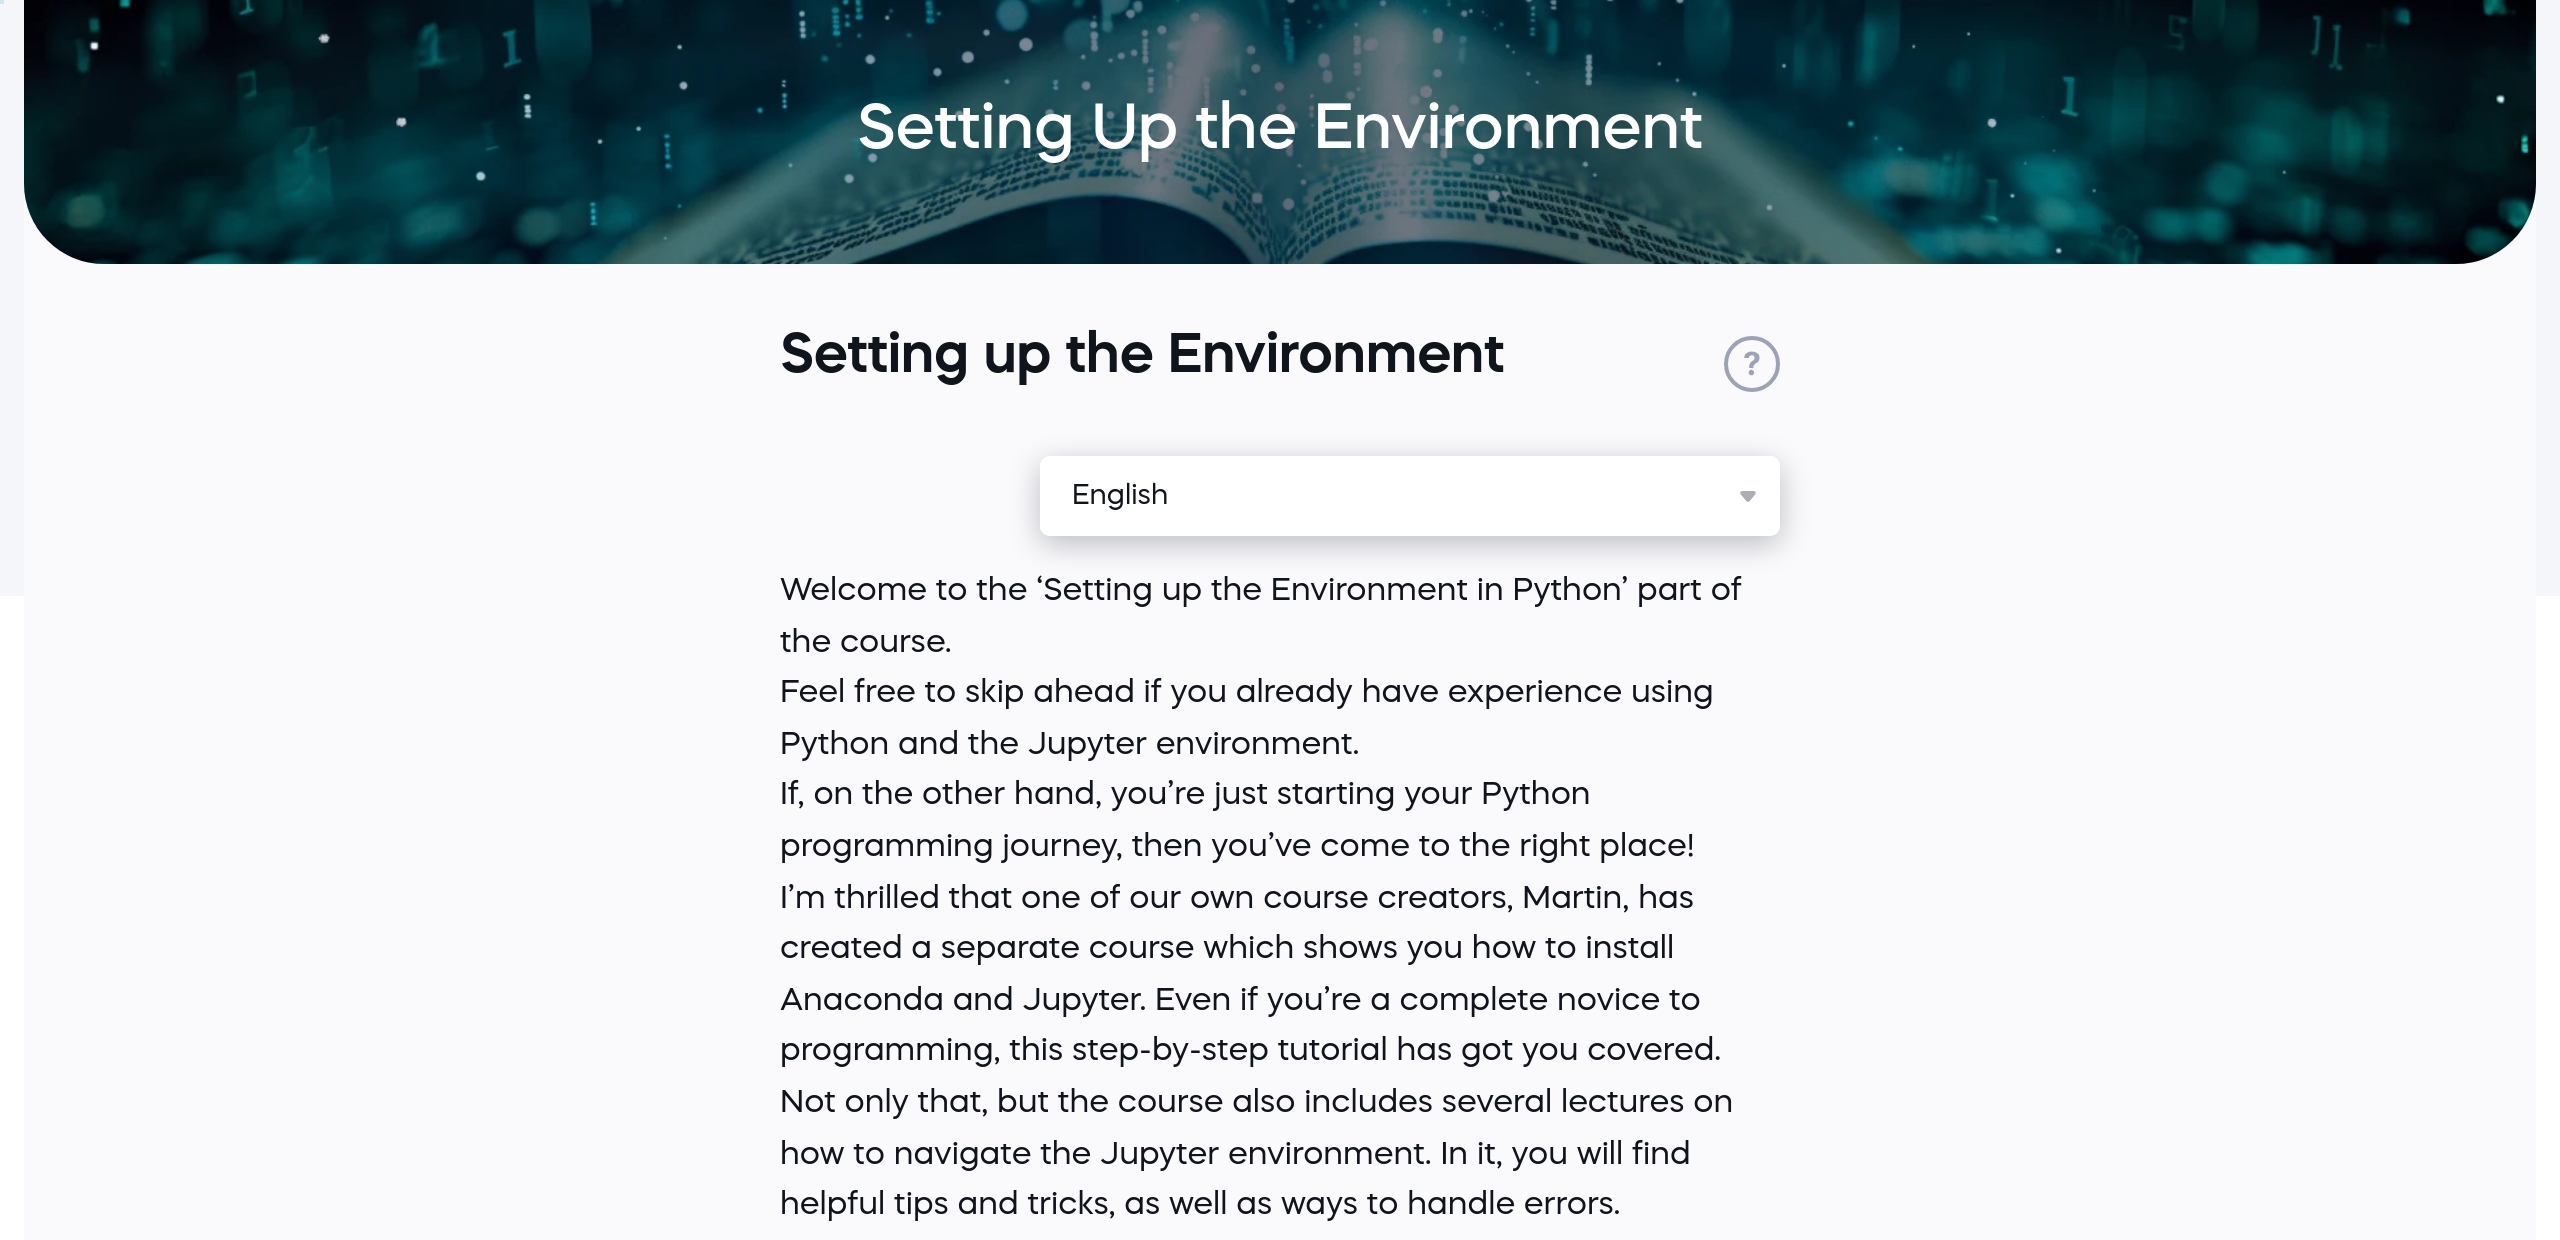
2.1 Setting up the Environment

1 min

Installing the Necessary Packages

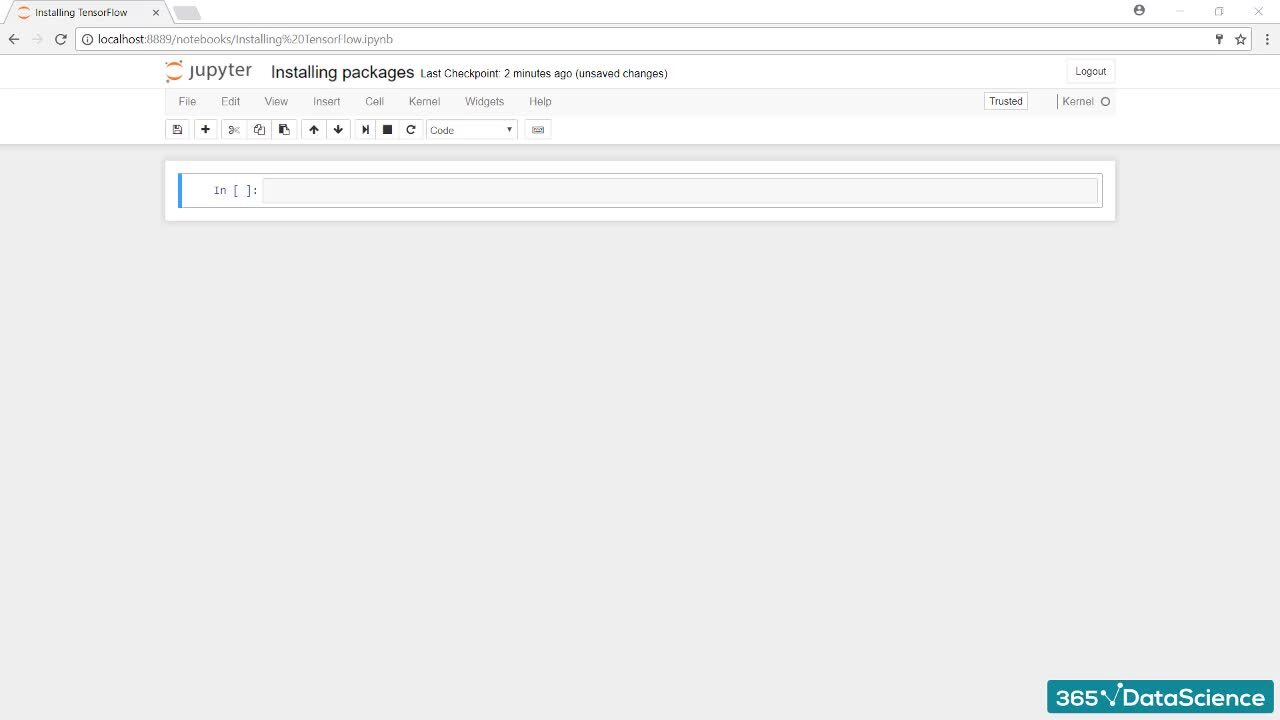
2.2 Installing the Necessary Packages

1 min

Introduction to Time Series Data

3.1 Introduction to Time Series Data

4 min

Notation for Time Series Data

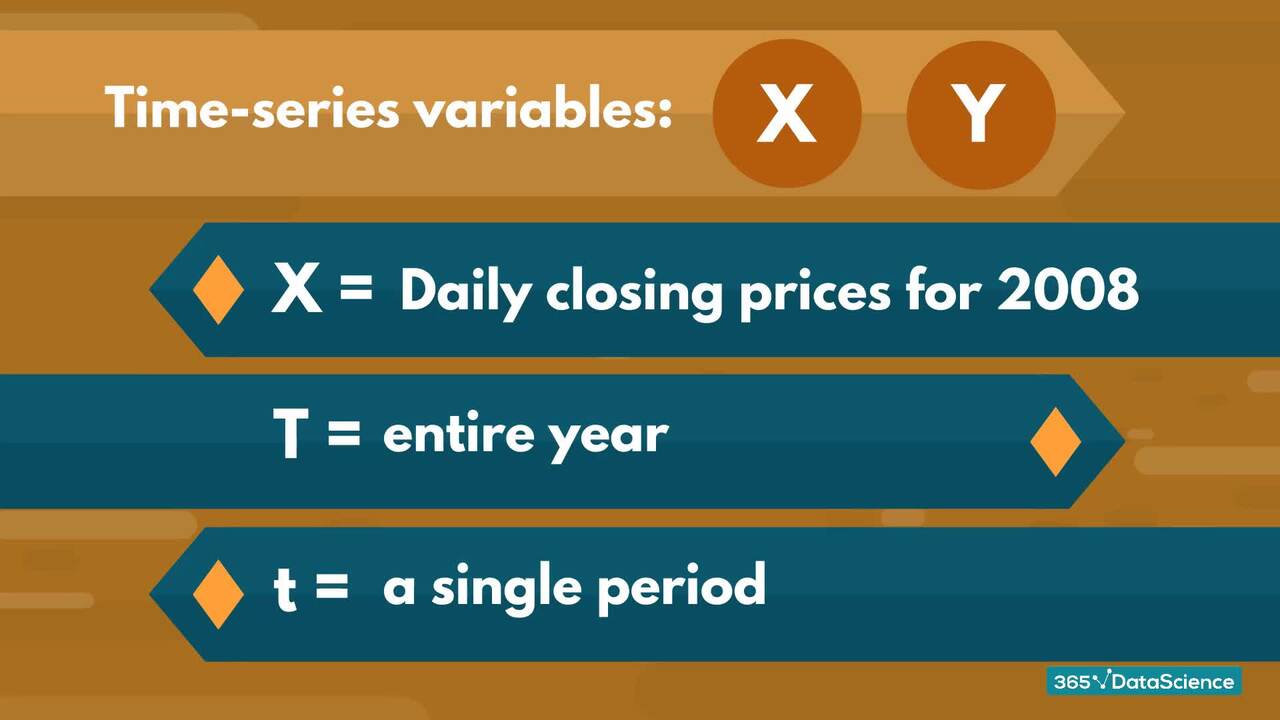
3.2 Notation for Time Series Data

1 min

Peculiarities of Time Series Data

3.3 Peculiarities of Time Series Data

3 min

Start for free

96%

of our students recommend

365 Data Science.

4.8

Based on 863 reviews

#1 most reviewed

AI and data learning platform on Trustpilot.

9 in 10

people walk away career-ready

with practical data and AI skills.

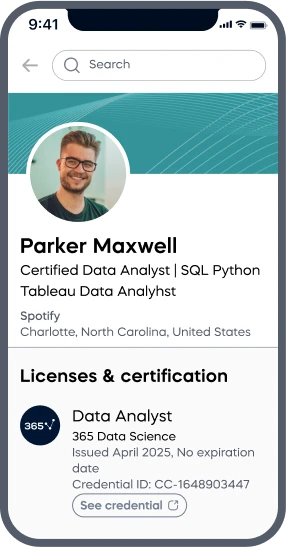
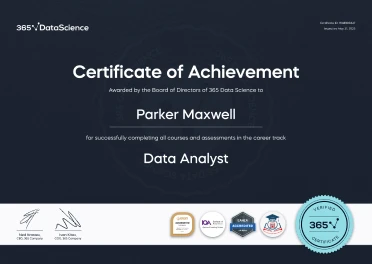
ACCREDITED certificates

Craft a resume and LinkedIn profile you’re proud of—featuring certificates recognized by leading global institutions.

Earn CPE-accredited credentials that showcase your dedication, growth, and essential skills—the qualities employers value most.

  • Institute of Analytics
  • The Association of Data Scientists
  • E-Learning Quality Network
  • European Agency for Higher Education and Accreditation
  • Global Association of Online Trainers and Examiners

Certificates are included with the Self-study learning plan.

A LinkedIn profile mockup on a mobile screen showing Parker Maxwell, a Certified Data Analyst, with credentials from 365 Data Science listed under Licenses & Certification. A 365 Data Science Certificate of Achievement awarded to Parker Maxwell for completing the Data Analyst career track, featuring accreditation badges and a gold “Verified Certificate” seal.

How it WORKS

  • Lessons
  • Exercises
  • Projects
  • Practice exams
  • AI mock interviews

Lessons

Learn through short, simple lessons—no prior experience in AI or data science needed.

Try for free

Exercises

Reinforce your learning with mini recaps, hands-on coding, flashcards, fill-in-the-blank activities, and other engaging exercises.

Try for free

Projects

Tackle real-world AI and data science projects—just like those faced by industry professionals every day.

Try for free

Practice exams

Track your progress and solidify your knowledge with regular practice exams.

Try for free

AI mock interviews

Prep for interviews with real-world tasks, popular questions, and real-time feedback.

Try for free

Student REVIEWS

A collage of student testimonials from 365 Data Science learners, featuring profile photos, names, job titles, and quotes or video play icons, showcasing diverse backgrounds and successful career transitions into AI and data science roles.