Student Onboarding Analysis in Tableau Project
Understanding the Onboarding Path: A Data-Driven Approach intermediate
With Elitsa Kaloyanova
Type: Course project
Duration: 5 Hours
Case Description
Backgound:An onboarding survey, in essence, is a structured questionnaire or feedback mechanism employed by online platforms to gain insights into new users' experiences and expectations during their initial interaction with the platform. This Student Onboarding Analysis in Tableau project delves into the onboarding experience of students using an e-learning platform. By analyzing customer onboarding survey data, we seek to understand better how students discover the platform, their learning aspirations, and ultimate career goals.
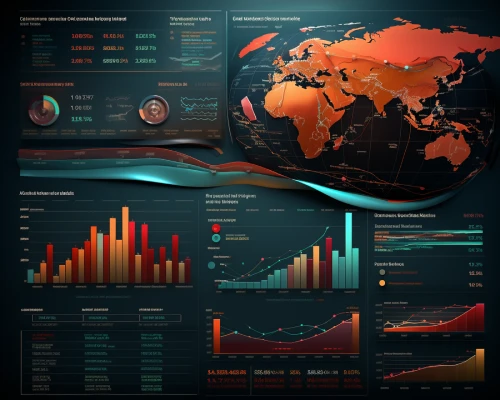
Objective: The critical aspect of this project is the development of an interactive dashboard in Tableau. The dashboard will showcase the survey completion trends over time and across different countries. It will present visualizations depicting how students discovered the platform, their desired learning areas, and career goals.
A crucial part is adding several interactive filters allowing users to slice and dice the data based on variables, such as registration date, survey completion date, student country, and subscription status and type. This will give stakeholders a dynamic and robust tool to derive insights from the onboarding survey data effectively.
Project requirements
For this Student Onboarding Analysis in Tableau project, you’ll be working with Tableau Public v4. 2022 or newer.
You are welcome to approach the analysis with an alternative data visualization software, but keep in mind that our guided instructions and solutions will be Tableau-specific.
Project files
With this Student Onboarding Analysis in Tableau project, you’ll work with a real dataset from our own 365 Company’s data. For this project, we have preprocessed the data, encoded all variables numerically, and dealt with missing values. In addition, we have restrictеd the dataset volume and protected the customers’ privacy.
You can download the data_visualization.csv, which you'll be using for your dashboard, as well as the visualization_data_legend.xslx files where you'll find a legend of all variables.
- 2 Project files
- Guided and unguided instructions
- Part 1: KPI – Overall Student Count
- Part 2: Timeline of Student Surveys
- Part 3: Location of Survey Completion
- Part 4: Discovery Sources
- Part 5: Exploring Learning Desires
- Part 6: Mapping Student Aspirations
- Part 7: Building the Dashboard and Adding Filters
- Part 8: Data Interpretation
- Quiz