color coding syntax issue
in
The Complete Data Visualization Course with Python, R, Tableau, and Excel
/
Bar Chart - Python - How to Create a Bar Chart
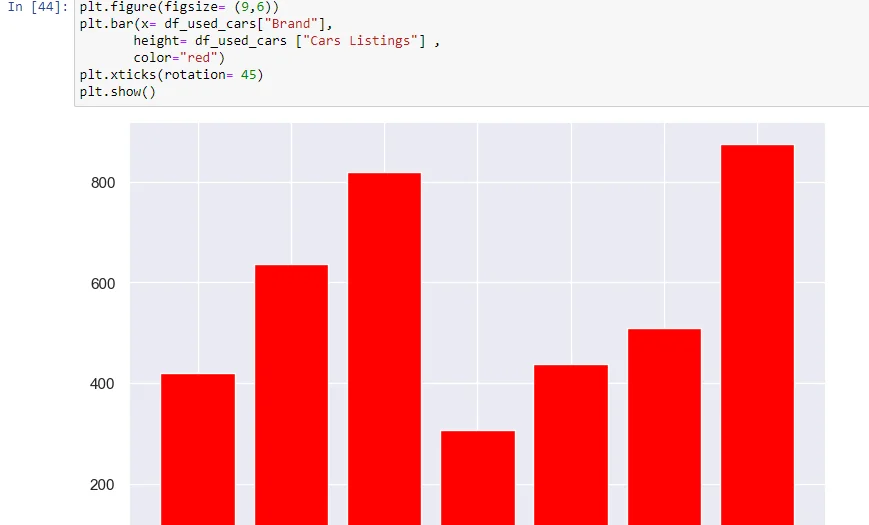
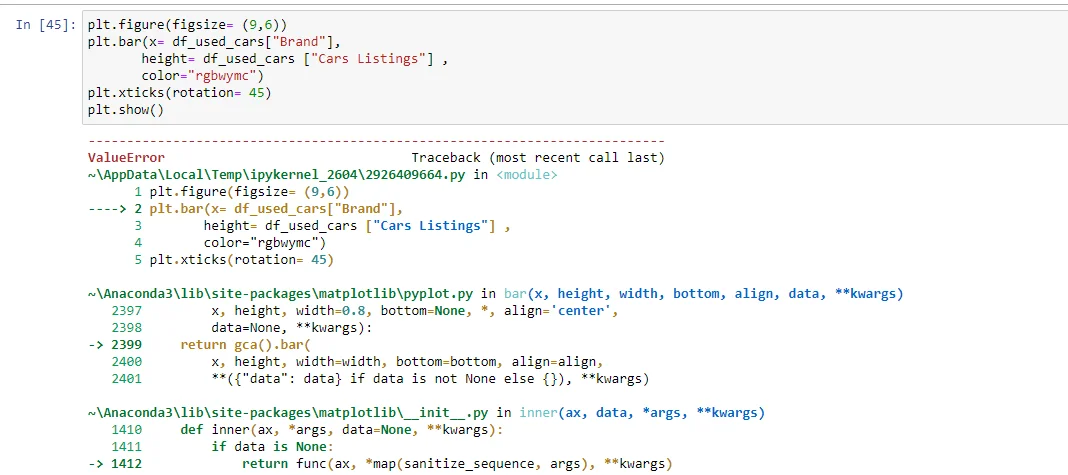
when I use a one color it works, when I try to use the initials that were in the video it seems that it doesn't work and give me an error! how can i solve it?

2 answers ( 0 marked as helpful)
Hi Abdelrahman,
thanks for reaching out! It seems that the functionality of using a single string as a color has been deprecated in some versions of matplotlib and is no longer supported, that's why you're getting the error. If you'd like to have individual colors for each bar, you can do the following:
1. Have a list of all the colors, using their full names
2. Pass that list for the color argument
Here is some example code:
colors = ["red","green","blue","white","yellow","magenta","cyan"]
plt.bar(x = df_used_cars["Brand"], #specify the x axis
        height = df_used_cars["Cars Listings"], #specify the y axis
        color = colors)
Let me know if this version works for you or if you have any further questions!
Best,
365 Eli
Thanks, It worked!