If lower coef std error indicates better estimate, is there convention on interpreting std err value
Hello lovely people,
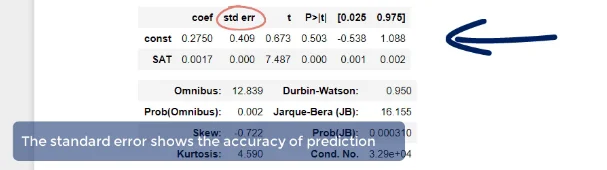
The video mentions that in the coefficients table, "The standard error shows the accuracy of prediction" and that the lower this is, the better the estimate (time after 3:00 mark).
I'm wondering if there any sort of conventional wisdom on how to interpret these values? It makes sense that if it's smaller (closer to 0) then the estimate is better, but in practice this wouldn't be exactly 0 every time, right?
I also recalled that the data visualization course mentions that R squared is an example of a value that interpretation of what's "acceptable" can vary depending on the specific industry.
In summary, my questions are:
(1) Are these std err of coefficients something typically used with assessing accuracy of prediction and is there a quantifiable way to do so? Or is it used elsewhere in statistical analysis rather than just assessing the raw value?
(2) Does some sort of conventional wisdom/rule of thumb exist for assessing these std err of coefficients (i.e. values that indicate "can roughly tell this isn't acceptable/doesn't look right")
Let me know if you need any clarification on my questions! Thanks for the help :)
Hi Erica,
Standard Error is used to construct confidence intervals. I don't think there would be a single ideal value or range that we would deem "good" since the scale of standard error depends on the variable or sample it is calculated from. What is more interpretable however, may be the confidence interval it helps create. For example, in the picture you attached, we can see the confidence interval for the constant, contains both a negative and positive value. As the video stated, we don't care as much about the accuracy of the line going through the origin however, you can imagine that if a similar confidence interval was seen for one of the independent variables, that may be a cause for concern. If a 95% confidence interval for an independent variable contained negative and positive values, that would mean we are not sure whether the independent variable positively or negatively affects the target. This would be quite problematic if we were trying to gain insights on the effects of each independent variable because something that we might deem important for increasing the price of a home for example, may actually be detrimental due to the negative values in the confidence interval. I hope that offers some insight despite not truly answering your question.