Question about layout/order of the graph
in
The Complete Data Visualization Course with Python, R, Tableau, and Excel
/
Stacked Area Chart - Tableau - How to Create a Stacked Area Chart
Dear 365datascience team,
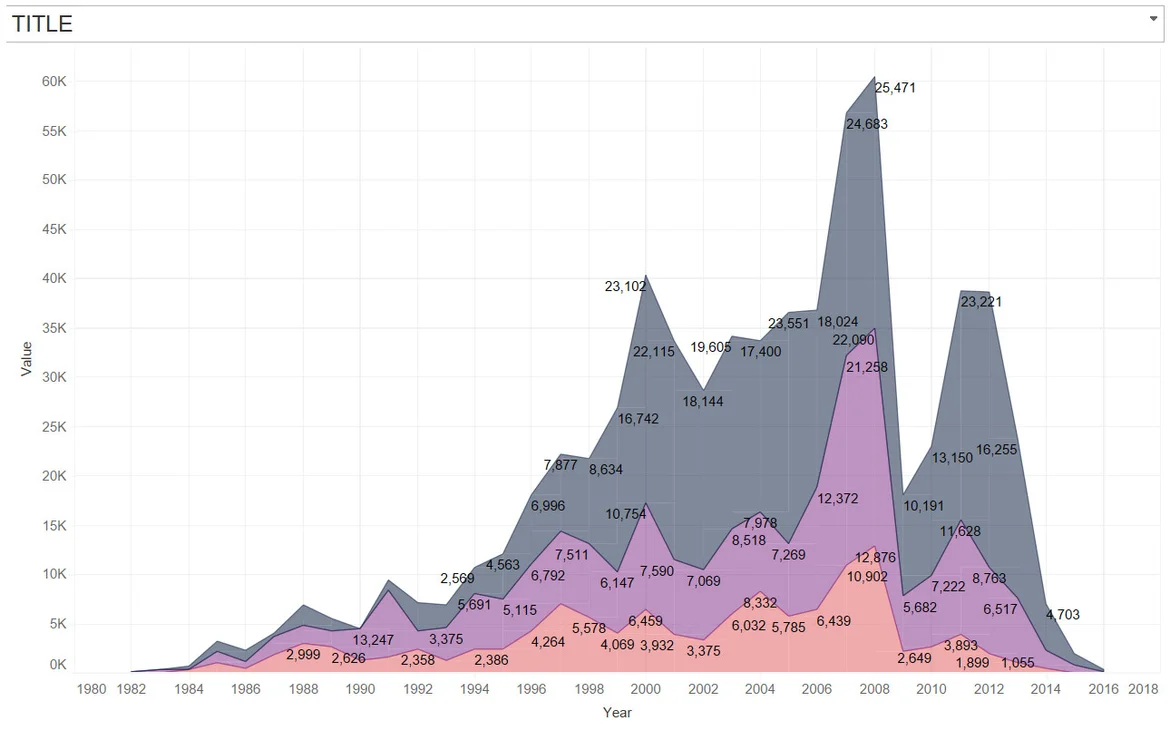
Since we should come up with a decending order categories graph,
Would it be better to look like this?
Besides, would it be better to change the value at y-axis based on each category?
Thank you!
1 answers ( 0 marked as helpful)
Hi Chun,
thanks for reaching out! You are right that the term descending would mean presenting the chart as you have. What is meant is a descending order from the bottom of the chart, the idea being that the largest category is at the bottom, the second largest on top of it and so on.
In terms of the y-axis, I believe that Tableau automatically rescales it, so it should be dinamic on its own.
Let me know if you have any other questions!
Best,
365 Eli