Shifting Concept
You said that if we substract 3 in terms of x from a given function, we move the graph to the left, and vice versa.
But mathematically, this is incorrect, since the change is inside the function, not outside. If it were outside the function, I would agree with you.
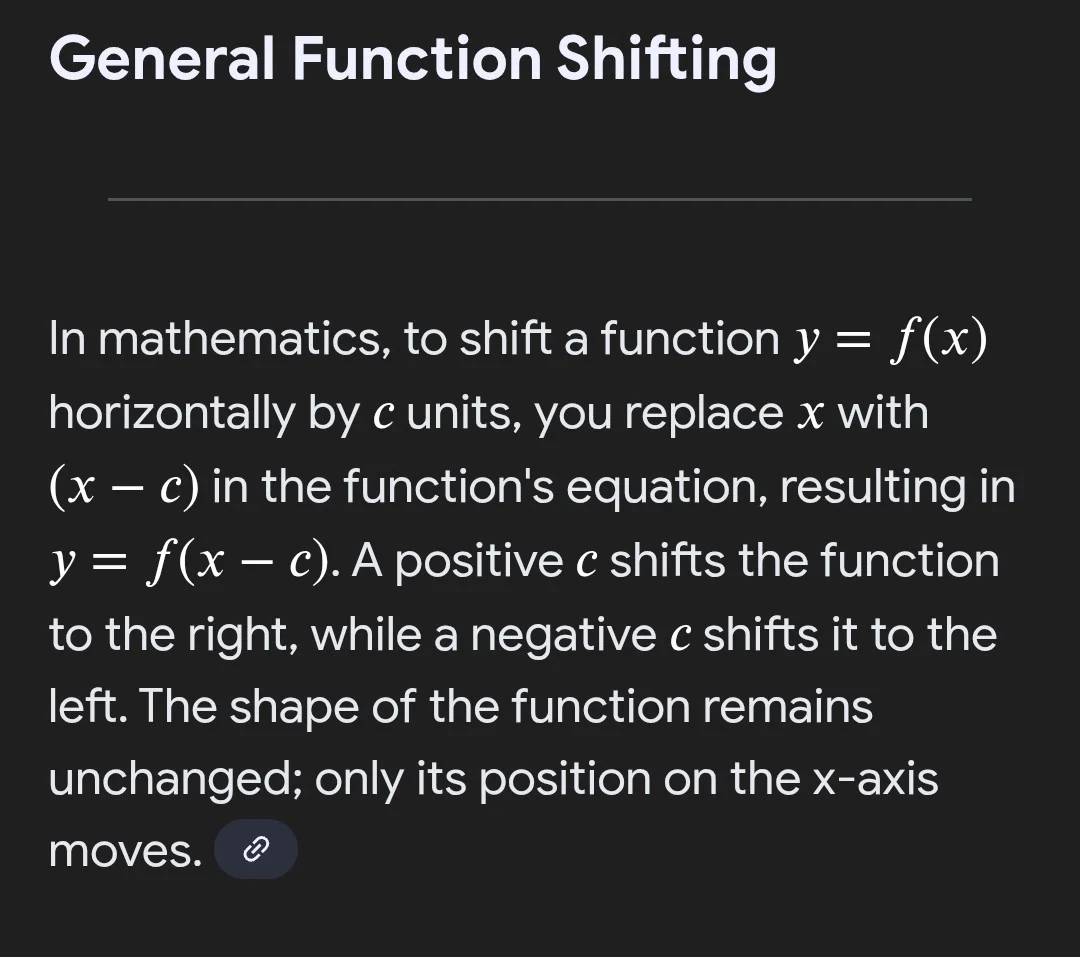
The statement should be reversed. In fact, if we change x variable inside any function, we will shift its graph to the opposit direction of the sign. That means, if we substract 3 from x inside a given function, we will shift the graph to the right, and vice versa.
It needs adjustment!
2 answers ( 0 marked as helpful)
Good morning,
I think there is a missunderstanding here and I'll use an example dataset to clarify
consider the following very basic discrete dataset:
[1, 2, 3, 4, 5]
And the corresponding probabilities are:
[0.1, 0.2, 0.4, 0.2, 0.1]
Then the graph would be:

Now, if we subtracted 3 from eac data point:
[1-3, 2-3, 3-3, 4-3, 5-3]
The new (Transformed) Dataset will be:
[-2, -1, 0, 1, 2]
And its graph will be:

And here is the plotting of the two graphs to see the shift:

Sorry, but you did not get my point. If you know shifting graphs in mathematics, you know what I am pointing to.
In your example, you did not give us a relation between x and f(x). You are just comparing old values of x to their new values, no matter what the probability of each x is. You should compare how the new values of x will shift the graph ( f(x) ).
You can also google it by asking "how graphs shift horizontally and vertically if x changes". You will find that if x increases, the graph f(x) (which is y) will shift to the left and if it decreases will shift to the right.
They would rather say in the video: if we subtracted x values by the mean, while fixing the probabilities of each point, the graph will shift to the left. But they linked the normal distribution shifting to the function shifting in mathematics, which is totally wrong because here in probability, they did use even a function to link x values to their probabilities.
You can play with desmos website and see how real functions shift horizontally.
In the example you gave, you have changed the probability of x values, and this is wrong here.
Watch shifting functions on khan academy for example :
https://youtu.be/RttvubuBhAE?si=TAk5-jKwEarU7Gvd