Data Science Templates
Boost your programming skills with free SQL, R, Excel, and Python templates and create top-notch projects for your portfolio.Accelerate your workflow with code-ready data science templates from 365 Data Science instructors—designed to enhance efficiency in your programming projects.
Discover a myriad of valuable resources—from a time-saving data science cheat sheet to data analysis and visualization templates in Excel and ready-to-use SQL, R, and Python coding shortcuts.
Whether you’re unsure how to approach a task or work on a time-sensitive project, these templates are designed to streamline your work and enhance productivity.
0 Results
Sorry, there were no matches for your search term. Try using a different term.
Most Popular Templates
Explore our top data science templates, recommended by our students and expert team of instructors—free to download.

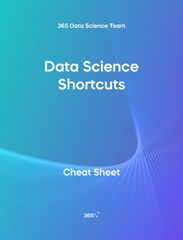
Data Science Shortcuts Cheat Sheet
Discover how to boost your productivity using this data science shortcuts cheat sheet with over 2,000 workarounds in Python IDEs, such as Jupyter, Spyder Rodeo, PyCharm, and Atom, compatible with various operating systems. Amplify your proficiency in R with R Studio shortcuts, streamline MATLAB operations, and manage databases efficiently with SQL shortcuts. Enhance data visualization in Tableau, easily manage Excel spreadsheets, and conduct statistical analyses seamlessly in SPSS and SAS. This data science shortcuts cheat sheet lets you speed up your everyday tasks while achieving your goals.
Learn More
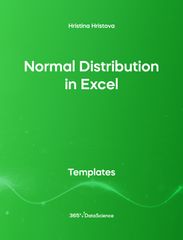
Normal Distribution in Excel Template
This Normal Distribution in Excel template demonstrates that the sum of 2 randomly thrown dice is normally distributed. Open the .xlsx file with Microsoft Excel. Study the structure of the file and experiment with different values. Some other related topics you might be interested to explore are Positive Skew in Excel, Zero Skew in Excel, Negative Skew in Excel, Uniform Distribution in Excel, Standard Normal Distribution in Excel You can now download the Excel template for free. Normal Distribution in Excel is among the topics covered in detail in the 365 Data Science program
Learn More
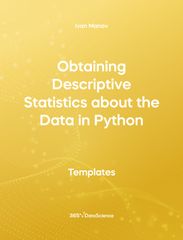
Obtaining Descriptive Statistics about the Data in Python
The following template demonstrates how to obtain an overview about the dataset. It shows the application of the .describe() method on a pandas Series object. Some other related topics you might be interested in are Delivering an Array with the Unique Values from a Dataset in Python, Converting Series into Arrays in Python, Ordering the Rows from a Data Table According to the Values in a Column in Python, Data Selection in Python, and Common Attributes for Working with DataFrames in Python. The Obtaining Descriptive Statistics about the Data in Python template is among the topics covered in detail in the 365 Program.
Learn More
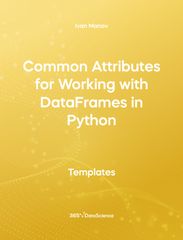
Common Attributes for Working with DataFrames in Python
The following template demonstrates the application of important pandas attributes when cleaning, preprocessing, and analyzing a dataset. Some other related topics you might be interested in are Data Selection in Python, Indexing with.iloc[] and .loc[] in Python, Delivering an Array with the Unique Values from a Dataset in Python, Converting Series into Arrays in Python, and Using Pandas Methods for Working with Series Objects in Python. The Common Attributes for Working with DataFrames in Python template is among the topics covered in detail in the 365 Program.
Learn MoreMost Popular Templates
Explore our top data science templates, recommended by our students and expert team of instructors—free to download.

Data Science Shortcuts Cheat Sheet
Discover how to boost your productivity using this data science shortcuts cheat sheet with over 2,000 workarounds in Python IDEs, such as Jupyter, Spyder Rodeo, PyCharm, and Atom, compatible with various operating systems. Amplify your proficiency in R with R Studio shortcuts, streamline MATLAB operations, and manage databases efficiently with SQL shortcuts. Enhance data visualization in Tableau, easily manage Excel spreadsheets, and conduct statistical analyses seamlessly in SPSS and SAS. This data science shortcuts cheat sheet lets you speed up your everyday tasks while achieving your goals.
Learn More
Normal Distribution in Excel Template
This Normal Distribution in Excel template demonstrates that the sum of 2 randomly thrown dice is normally distributed. Open the .xlsx file with Microsoft Excel. Study the structure of the file and experiment with different values. Some other related topics you might be interested to explore are Positive Skew in Excel, Zero Skew in Excel, Negative Skew in Excel, Uniform Distribution in Excel, Standard Normal Distribution in Excel You can now download the Excel template for free. Normal Distribution in Excel is among the topics covered in detail in the 365 Data Science program
Learn More
Obtaining Descriptive Statistics about the Data in Python
The following template demonstrates how to obtain an overview about the dataset. It shows the application of the .describe() method on a pandas Series object. Some other related topics you might be interested in are Delivering an Array with the Unique Values from a Dataset in Python, Converting Series into Arrays in Python, Ordering the Rows from a Data Table According to the Values in a Column in Python, Data Selection in Python, and Common Attributes for Working with DataFrames in Python. The Obtaining Descriptive Statistics about the Data in Python template is among the topics covered in detail in the 365 Program.
Learn More
Common Attributes for Working with DataFrames in Python
The following template demonstrates the application of important pandas attributes when cleaning, preprocessing, and analyzing a dataset. Some other related topics you might be interested in are Data Selection in Python, Indexing with.iloc[] and .loc[] in Python, Delivering an Array with the Unique Values from a Dataset in Python, Converting Series into Arrays in Python, and Using Pandas Methods for Working with Series Objects in Python. The Common Attributes for Working with DataFrames in Python template is among the topics covered in detail in the 365 Program.
Learn MoreJoin 3M+ Students and Start Learning
Learn from the best, develop an invaluable skillset, and secure a job in data and AI.