Time Series Data What do the stockbrokers and airplane companies have in common? The answer to this riddle is: They both use time-series data. In this article, we are going to explain the concept of time-series data. We will discover how it differs from panel or cross-sectional data and why time-series analysis is tricky. After that, we’ll introduce you to some of the most basic time-series notation and terminology. All of this should give you a good idea of the role time series play in data science! Let’s begin with the definition.
What is a Time Series?
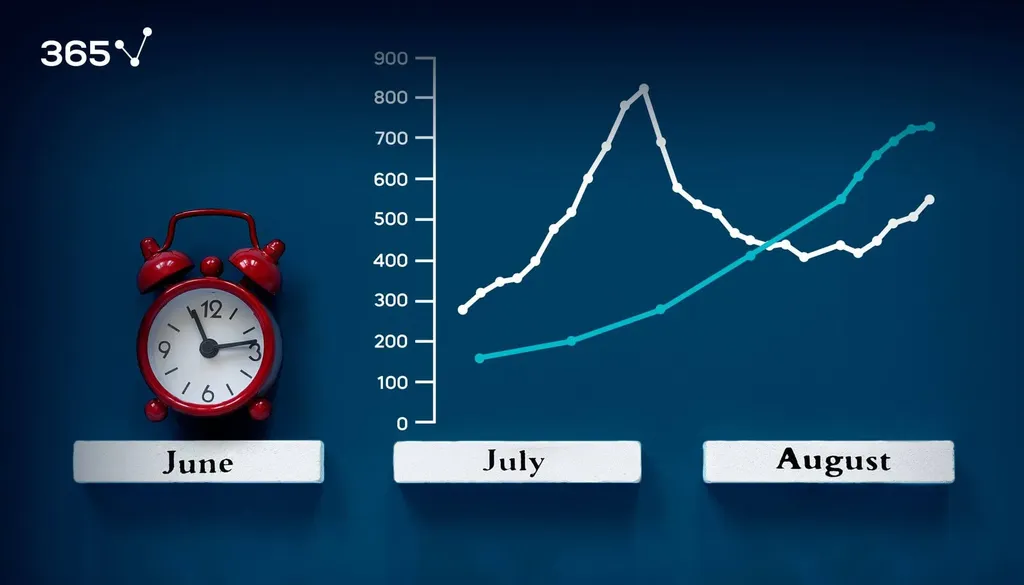
A time series is a sequence of information that attaches a time period to each value. The value can be pretty much anything measurable that depends on time in some way, like prices, humidity, or a number of people. As long as the values we record are unambiguous, any medium could be measured with time series.
What Are Some Prominent Features of Time Series?
Time Period
For starters, there aren’t any limitations regarding the total time span of a time series. It could be a minute, a day, a month, or even a century. All that’s needed is a starting and an ending point. Of course, there are usually numerous points in-between and the interval of time separating two consecutive ones is called a “time period”. For example, if the data was recorded once per day from 1/1/2000 to New Year’s Eve 2009, a single time period would be a day, while the entire time span would be a decade.
Frequency
The “frequency” of the dataset tells us how often the values of the data set are recorded. To be able to analyse time series in a meaningful way, all time-periods must be equal and clearly defined. This, in turn, results in a constant frequency, so you see how the two features are related. This frequency is a measurement of time and could range from a few milliseconds to several decades. However, the ones we most commonly encounter are daily, monthly, quarterly and annual.
Patterns
Lastly, we can expect the patterns we observe in time-series to persist in the future. That is why we often try to predict the future by analysing recorded values. Now that you’re familiar with the main features of time-series data, let’s look at some examples.
How Do We Use Time Series Data in Weather Prediction?
Meteorologists often cope with the task of forecasting the weather for days ahead. To make even remotely accurate predictions on a consistent basis, they rely on analysing past data. That said, if the data is not ordered chronologically, finding the correct pattern would be extremely difficult. For instance, simply knowing the highest temperature for the last 5 days would be useless unless we know which value corresponds to each day. Why? Because chances that the temperature rose 5 days in a row or dropped 5 days in a row are equal. Thus, without the corresponding time periods for each value, the data is much less relevant.
How Do We Use Time Series Data in Business?
Time Series Data in Finance
In the world of business, time-series data finds large application in finance. For investors, as well as company owners, it’s crucial to determine whether prices, returns, profits, and sales will increase or decrease in the future. Therefore, a common topic in Time-Series Analysis is determining the efficiency and stability of financial markets and portfolios. For instance, if we can accurately predict the prices of market indexes from past values, then these markets aren’t very efficient.
Time Series Data in Sales Forecasting
Another application of time series in business comes in the form of sales forecasting. In other words, we’re looking at trends from before to anticipate future demands. This enables companies to fill up their warehouses, so they don’t run out of stock. Additionally, it helps them adjust prices to make the biggest possible profit. A prime example of such behavior comes from Airplane companies, which manipulate their prices depending on expected demand. This “demand” is forecasted using the demand from previous years and months, so it utilizes time-series data. If there is a significant relationship between past and present values, like the one we've just suggested, then we are dealing with time dependency.
What Is Time Dependency in Time Series Data?
Time-series data is usually “time-dependent”. This means the values for every period are not only affected by outside factors, but also by the values of past periods. For instance, we expect tomorrow’s temperature outside to be within some reasonable proximity to today’s values. Furthermore, time-series data can suffer from “seasonality”. Some values like rain or temperature vary depending on the time of day and the season of the year. Since it’s a repeating cycle, we can anticipate these changes and account for them when making our predictions. We don't often observe “seasonality” as a trait in regular data. And that is only logical. When there is no chronological order, we don’t expect repeating cycles, right?
How Do We Denote Time Series?
In order to express Time-Series efficiently, we need to introduce some notation. We describe time-series variables with capital letters of the Latin alphabet like X or Y. For example, we can label the prices of the S&P 500 over some period of time as X. We describe the entire period covered by a time-series with capital “T”, while we use lower-case “t” to describe a single period within the interval. Now, imagine we had the daily closing prices for the S&P 500 for the entire 2008. Given the uppercase “T” represents the entire year, the lower-case “t” would represent a single day. Then, to denote the closing price on a specific day, we would use “X of t”. Alternatively, we could simply write the precise date, time or year as a subscript. Since “t” represents the order of the period we are interested in, we express the previous period as “t minus 1”. Similarly, we express the next period as “t plus 1”. This notation is extremely helpful when trying to model time-series data to make predictions about the future.
Some Final Words...
All things considered, time-series data has many important applications in today’s data-driven world. And, although this article is a great first introduction to the topic, it’s barely touching the surface. There is much more to learn about time series as a fundamental part of data science and the skills to land a job as a quantitative finance analyst, a data analyst, or a data scientist. So, enroll in our Time Series Analysis with Python course to take your skills to the next level.
Ready to Start Learning Time Series Analysis and Data Science?
Check out the complete Data Science Program today. If you still aren’t sure you want to turn your interest in data science into a solid career, we also offer a free preview version of the Data Science Program. You’ll receive 12 hours of beginner to advanced content for free. It’s a great way to see if the program is right for you.


