 Data science. It's a discipline that has been constantly evolving. Just when you're sure you've worked out what a data scientist is, someone goes and pulls the rug out from under you! With a barrage of new terms and buzzwords flying around, even HR managers in the field get confused, so how are you supposed to keep up with the fields of business and data analytics, data science, business intelligence, machine learning, and AI?
It's about time someone created a diagram which shows how these similar-yet-unique areas intertwine! Well, hold on to your hats, because we've only gone and done it!
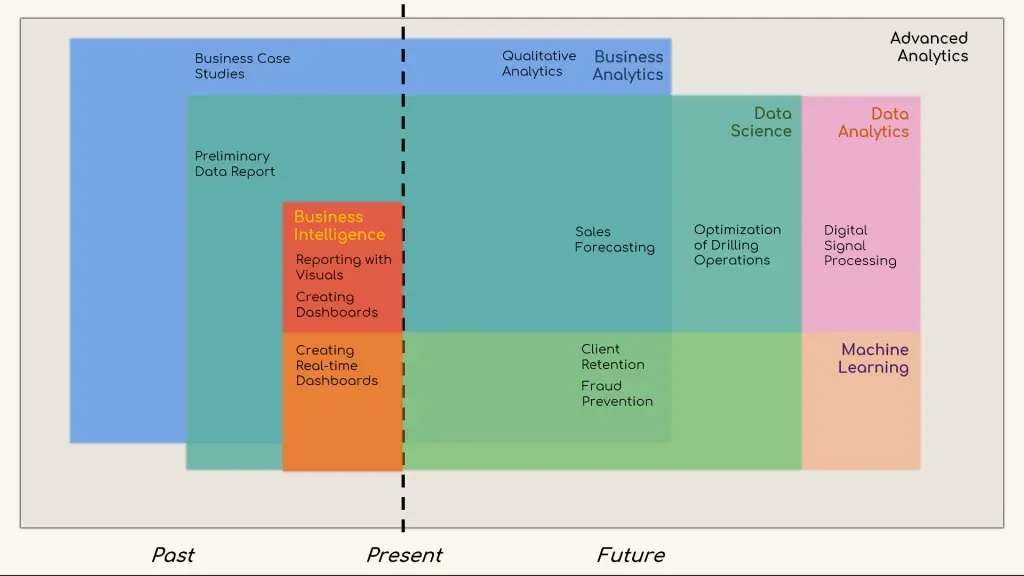
Here it is!
May seem a bit complicated in the beginning, but I assure you that everything will be clear after we walk through it.
Let's start at the very beginning.
Business Analytics
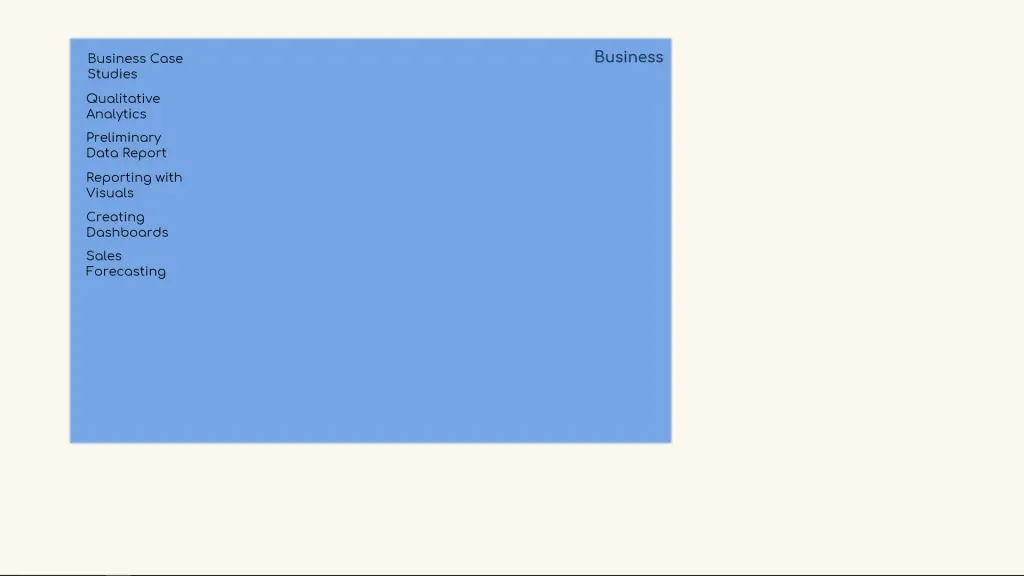
Before talking about data science, it is a good idea to start from a much older concept - business. Here's a list of branches from the business field:
- Business case studies.
- qualitative analytics.
- preliminary data report.
- reporting with visuals.
- creating dashboards.
- sales forecasting.
Don’t worry if you don't know what they all mean.
For a second, have a think which ones are related to business, to data, or both.
Business Analytics vs Data Analytics
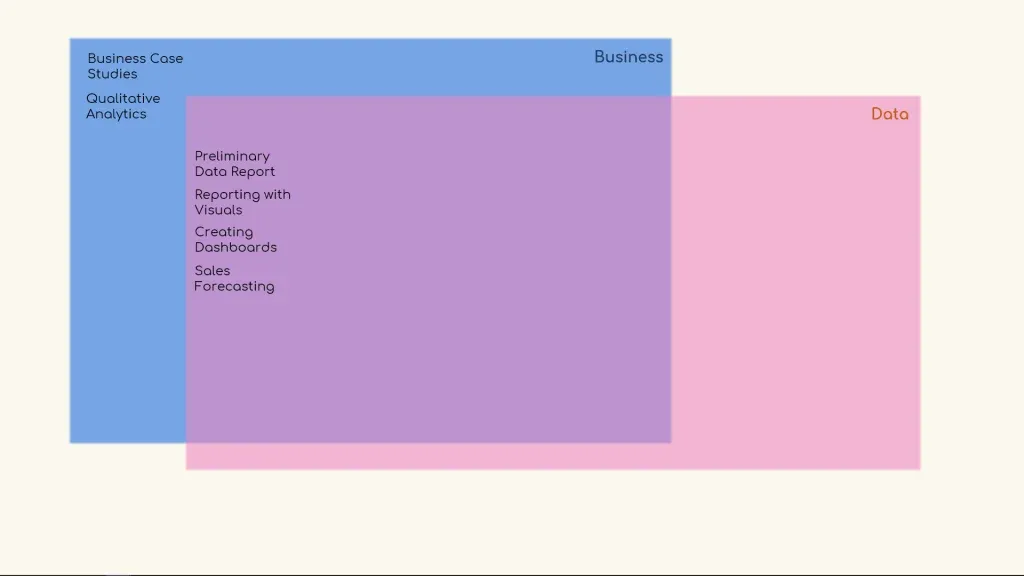
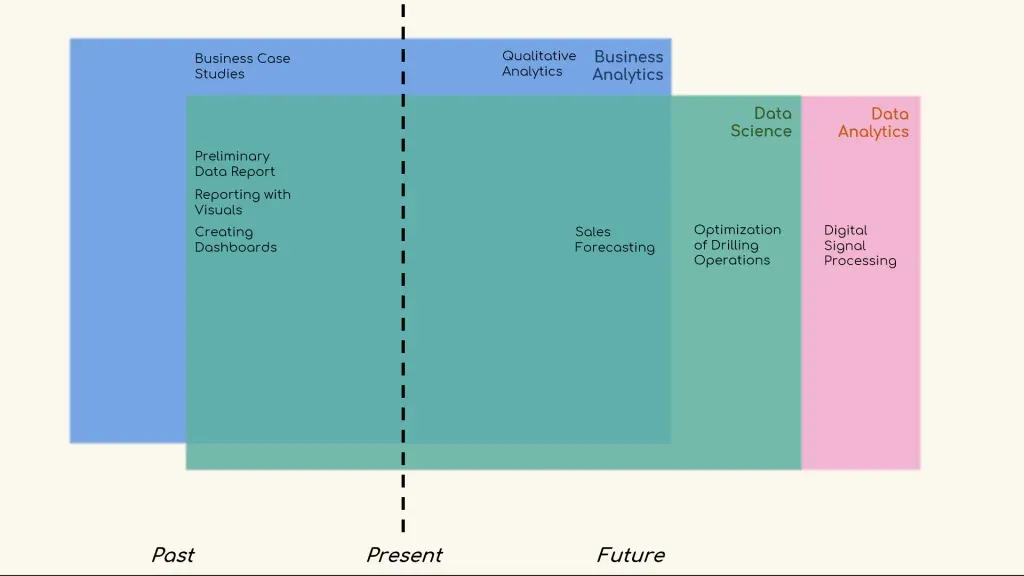
Look at the picture below to check if your ideas matched ours. Note that the blue rectangle contains activities related to business and the pink one to data. If something sits in an area that overlaps, then it is related to both fields.
As you can see, all terms are business activities but only some are data-driven, the rest of them are experience-driven.
You’ll need data to create:
- A preliminary report
- A visual representation of your company’s performance for last year
- A business dashboard
- A forecast for the future sales of your company.
So, these four labels sit comfortably in the overlapping area.
What about the other two terms?
- Business case studies
- Qualitative analytics
Business case studies are real-world experiences of how business people and companies succeed or fail. Qualitative analytics is about using your intuition and knowledge to assist in future planning. You don’t need a dataset to learn from either. Thus, both remain in the blue rectangle.
Do those fields depend on time?
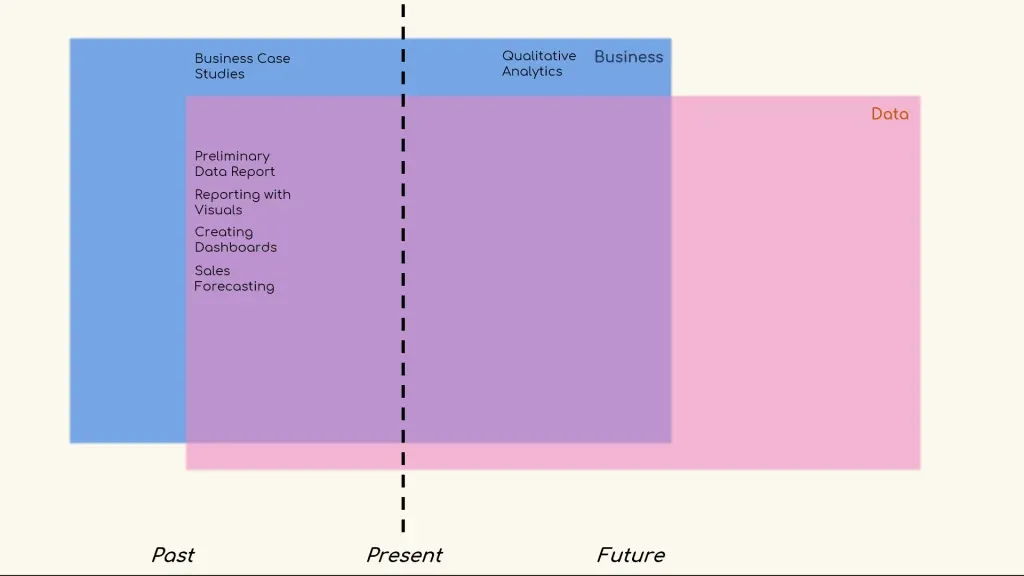
Now would be the perfect time to introduce a timeline. Some of the terms you see refer to activities that explain past behavior, while others refer to activities used for predicting future behavior. We’re going to put a line through the middle to represent the present. Therefore, all terms that are on the right of this line will regard future planning and forecasting, those that are on the left of the line will be related to the analysis of past events or data.
Again, take a moment to decide which aspects refer to which point in time.
Well?
How’d you do?
Let me explain why we segregated it as we did.
Business case studies examine events that have already happened. For instance, one could learn from them and attempt to prevent making a similar mistake in the future, so this activity refers to the past.
Contrast it to the other business term, ‘qualitative analytics’ which includes working with tools that help predict future behavior and you’ll realize this must be placed on the right.
Preparing a report or a dashboard is always a reflection of past data, these terms will remain on the left. Forecasting, though, is a future-oriented activity, we’ve put it to the right of the black line, but not too much – it must still belong to the sphere of business, so it must be in the area where business analytics and data intersect.
Alright! Hopefully, we’re starting to get our heads around many of these terms and where they fit with each other.
Business Analytics vs Data Analytics vs Data Science
Data science is a discipline reliant on data availability, at the same time, business analytics does not completely rely on data; be that as it may, data science incorporates part of data analytics. Mostly the part that uses complex mathematical, statistical, and programming tools. Consequently, this green rectangle, representing ‘data science’ on our diagram, does not overlap with ‘data analytics’ completely. But it does reach a point beyond the area of business analytics.
Let us show you another picture to make things clearer.
Does this mean that the preliminary data report, reporting with visuals, creating dashboards, and sales forecasting are of interest to a data scientist? Yes, absolutely.
You notice we added a couple of aspects that weren’t there before, good eye! ‘Optimization of drilling operations’ and ‘digital signal processing’ are a couple of examples that fit into sub-areas outside of business. We’ll expand on them now.
Consider the oil and gas industry, and the optimization of drilling operations. This is a perfect example of an aspect which requires data science and data analytics but NOT business. We use data science to improve predictions based on data extracted from activities typical for drilling efficiency. And that certainly isn’t business analytics.
We use digital signal to represent data in the form of discrete values. Therefore, we can apply data analytics to digital signal to produce a higher quality signal, without going into data science.
The diagram is looking a bit livelier, but we’re not quite done yet.
Next, we’re going to add ‘business intelligence’.
What is business intelligence? How does it fit into the picture?
Author's note: If you are interested in pursuing a career as a data scientist, go ahead and download our free data science career guide
Business Analytics vs Data Analytics vs Data Science vs Business Intelligence
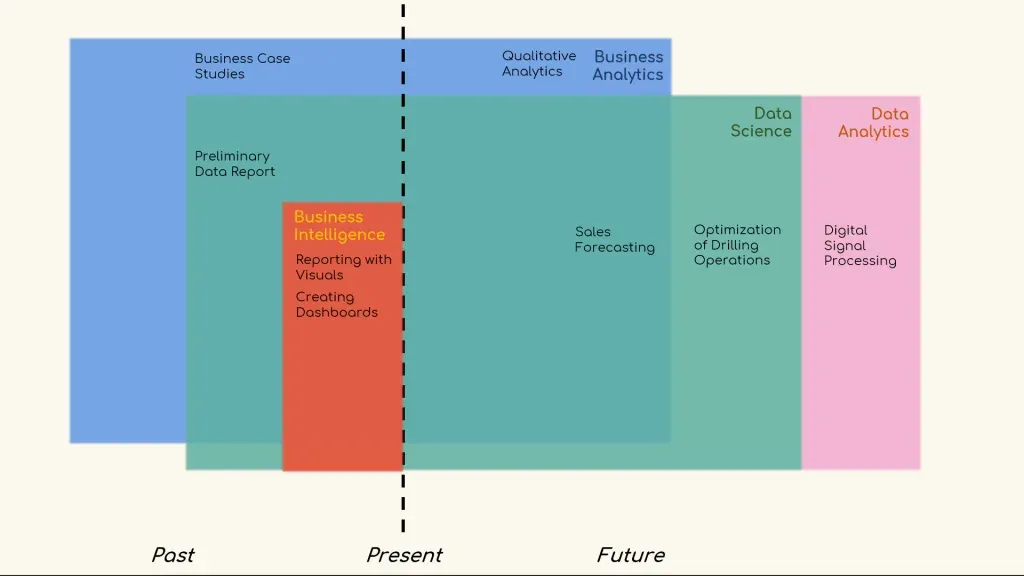
Business intelligence, or BI, is the process of analyzing and reporting historical business data. With this information can you imagine where the BI section will sit?
Do you want an explanation? Let us oblige.
After reports and dashboards have been prepared, they are used to make informed strategic and tactical business decisions by end-users such as the general manager. Concisely put, business intelligence aims to explain past events using business data.
It must go on the left of the timeline as it deals only with past events and it must sit within the data science rectangle as a sub-field.
Business intelligence fits comfortably within data science because it is the preliminary step of predictive analytics. It makes sense, when you think about it – first you must analyse past data and extract useful insights. Using these inferences will allow you to create appropriate models that could predict the future of your business accurately.
‘Preliminary data report’ is the first step of any data analysis. Consider it as data science; this term stays where it was.
As with ‘reporting and creating dashboards’, these are what business intelligence is all about. So, we place these two into the orange rectangle.
And that’s it for business intelligence! (Unless you want to know how to become a Business Intelligence analyst - then you can learn much more about this career path and other gateways into a data science career in Starting a Career in Data Science: The Ultimate Guide)
Business Analytics vs Data Analytics vs Business Intelligence vs Data Science vs Machine Learning vs Artificial Intelligence
Let’s delve into the controversial yet expanding field of ‘artificial intelligence’ (AI) and its sub-field ‘Machine learning’ (ML).
The ability of machines to predict outcomes without being explicitly programmed to do so is regarded as machine learning. Expanding on this, ML is about creating and implementing algorithms that let machines receive data and use this data to analyse patterns, make predictions and give recommendations on their own.
Can you imagine where the Machine learning and AI sections will join in?
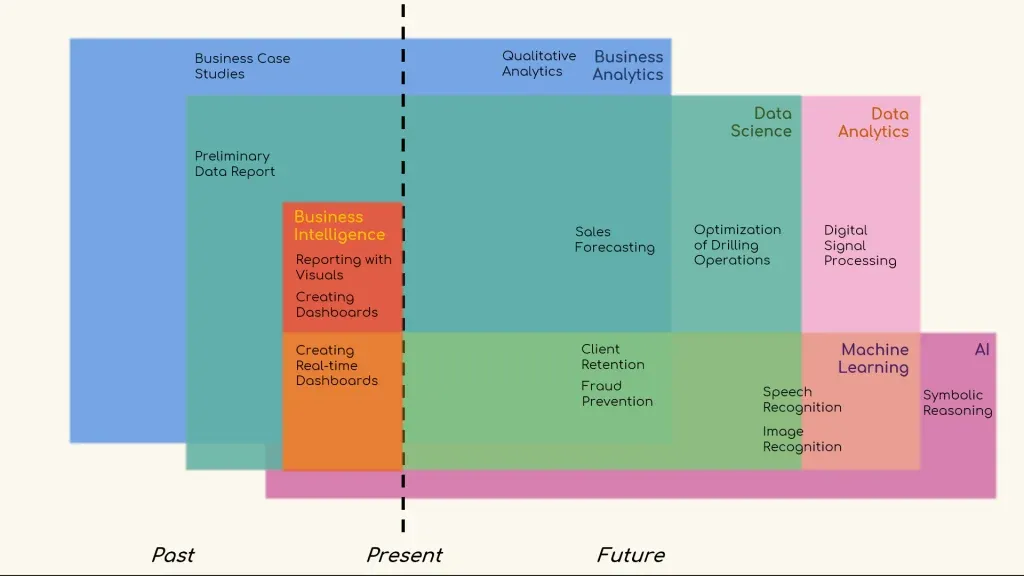
Machine learning cannot be implemented without data; hence it should stay within ‘data analytics’ completely. We’re going out on a limb here as it is debatable whether this is correct. Some argue that data analytics and ML are two unrelated scientific fields. For the sake of argument, we will let the machine learning and data analytics rectangles overlap.
Moreover, ML should expand slightly to the left of the vertical line. The reason for that is the increasing tendency towards applying machine learning tools to the context of business intelligence. We are interested in how tools from machine learning can help us improve the accuracy of our estimations.
AI is about simulating human knowledge and decision making with computers. It is quite a general term that can have a philosophical interpretation.
We, as humans, have only managed to reach AI through machine learning.
AI outside of this area is a detailed topic that, while interesting, is not related to what we are trying to achieve here. We have mentioned it just to avoid the confusion of where it stands relative to the other fields of interest.
Time to expand on the aspects which you can see we’ve moved and added to the diagram.
The demand for accurate real-time dashboards opens space for more machine learning applications.
Machine learning software can pull data from third-party companies, such as Facebook or Shopify, detect new patterns from their data, and thus suggest real-time recommendations and insights to managers and other decision makers. This is a wonderful way to improve the performance of your business as soon as there is a chance to do so. In general, there is a lot of potential for development in this field.
Turning to the other side of the vertical line, outside of BI but still within the other disciplines are two typical business activities where machine learning plays a big part. Client retention and acquisition uses ML to help develop models that predict what a client’s next purchase would be, for example.
We also apply ML to fraud prevention as another example. We can feed a machine with prior fraudulent activity data. It will find patterns which the human brain is incapable of seeing. Having a model which can detect such transactions or operations in real time has helped the financial system prevent a huge amount of fraudulent activity.
These examples are not the first that would usually spring to mind when talking AI and ML. Usually, speech and image recognition are among the most popular examples. As they are already being implemented in products like Siri, Cortana, Google’s Assistant, and more impressively – self-driving cars.
Naturally, these two examples are outside the business context. And it is debatable whether they could be placed under the umbrella of data science, data analytics, both or neither. As it is a hot topic for discussion right now, we think they are worth mentioning.
However, to avoid further confusion and disputes, let’s take speech and image recognition out of the picture.
Finally, the example that is artificial intelligence but not machine learning is ‘symbolic reasoning’.
It is based on high-level human-readable representations of problems and logic. It was once a trend in the past when people were trying to create human-like intelligence. Today though, machine learning is the only form of general artificial intelligence that is being applied and symbolic AI is rarely encountered, let alone practiced.
So along with speech and image recognition, we can remove symbolic AI from the equation also. This will leave us with only what we are interested in!
Nice!
Now, we would like to mention a term that has invaded almost all business and data science glossaries… ‘advanced analytics’.
Business Analytics vs Data Analytics vs Business Intelligence vs Data Science vs Machine Learning vs Advanced Analytics
It is a marketing term, coming from people who want to say that the type of analytics they are dealing with is not easy-to-handle.
This is a subjective way of looking at it. Often intimidating sounding terms are used to discourage learning and create prestige; however, we are here to attempt to clarify the terms within analytics. And ‘advanced analytics’ is technically a term that exists. So, we will collectively group all areas of analytics under ‘advanced analytics’; with the idea that any part of analytics can seem advanced at first. But that no part is exclusively or permanently within this category.
Remember that all areas intertwine, and what we show here is not a strict representation of commonly-accepted meanings and definitions. It is all matter of interpretation, and this diagram is our vision of data science. The locations of some of the components could be controversial; however, we believe this is a very comprehensive depiction of what these disciplines are about and how they overlap.
We also want to mention, the position and the size of the rectangles show conceptual similarities and differences, not complexity.
And here's how it works step by step:

Well, I hope this has made the jumble of disciplines a little clearer, I also hope you enjoyed building this diagram with us. If you want to learn more, check out our Introduction to Data and Data Science course.

