• Learn
    • Courses
    • Career Tracks
    • Upcoming Courses
  • Certificates
    • Career Track Certificate
    • Course Certificate
  • Resources
    • All Resources
    • Course Notes
    • Templates
    • Infographics
    • Career Guides
    • Practice Exams
    • Blog
    • Success Stories
  • Pricing
  • Business
    • Team Plan
    • Live Trainings
Log In Sign Up
Follow this topic
Share
Abdulrahman Yasser Mahmoud
Last answered:

12 Nov 2021

Posted on:

12 Nov 2021

0

can't split the data into two columns

in The Complete Data Visualization Course with Python, R, Tableau, and Excel / Regression Plot - What Makes a Good Regression Plot
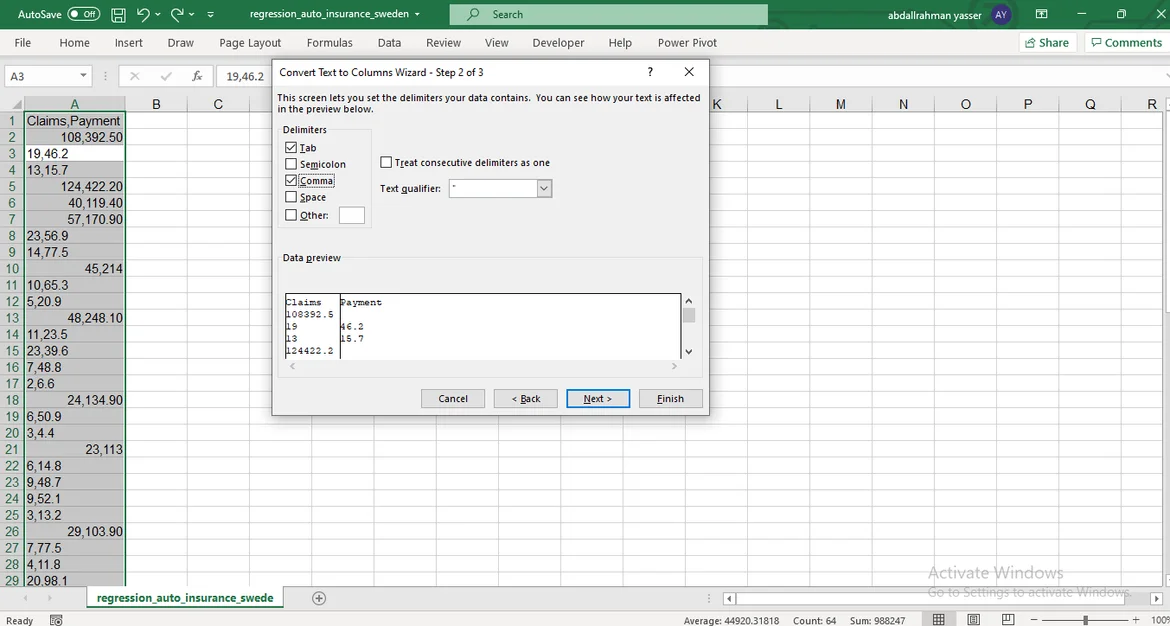
2 answers ( 0 marked as helpful)
PRAFUL NIMBAJI CHALAKH
Posted on:

12 Nov 2021

0
Abdulrahman Yasser Mahmoud
Posted on:

12 Nov 2021

0

Submit an answer

related questions

Le Van Cuong
4
16
Date in this lesson don't have in the data set at the last lesson!
Syed Amanullah
0
8
Tableau Data modeling
Shivaprasad Kaladagi
0
6
Resolved: Materials missing for Data Visualization assignments
Said SOUHASSOU
0
6
Data and Homework with Tableau
Sam Parker
0
6
How to import data to create a bar chart in R studio?
Bernie Tabuzo
0
4
Hi, i can't figure out why 'bar_chart' is not found?
Bernie Tabuzo
0
4
Hi, i can't figure it out why still isn't successful my location path where i save my bar_chart_data
Asmaa Abdulhamid
0
4
the object (Brand) can't be found!!!! why???

All the Data Science Courses You Need

About

  • About Us
  • Instructors
  • Contact Us
  • Pricing

Learn

  • Courses
  • Career tracks
  • Career Certificate
  • Course Certificate

Resources

  • Course Notes
  • Templates
  • Career Guides
  • Practice exams
  • Blog

Platform

  • Success stories
  • Q&A Hub
  • Help Center
  • Verify Certificate
© 2023 365 Data Science. All Rights Reserved.
Terms of Use Privacy Policy Cookies