Code Update Required
in
The Complete Data Visualization Course with Python, R, Tableau, and Excel
/
Scatter Plot - Python - How to Create a Scatter Plot
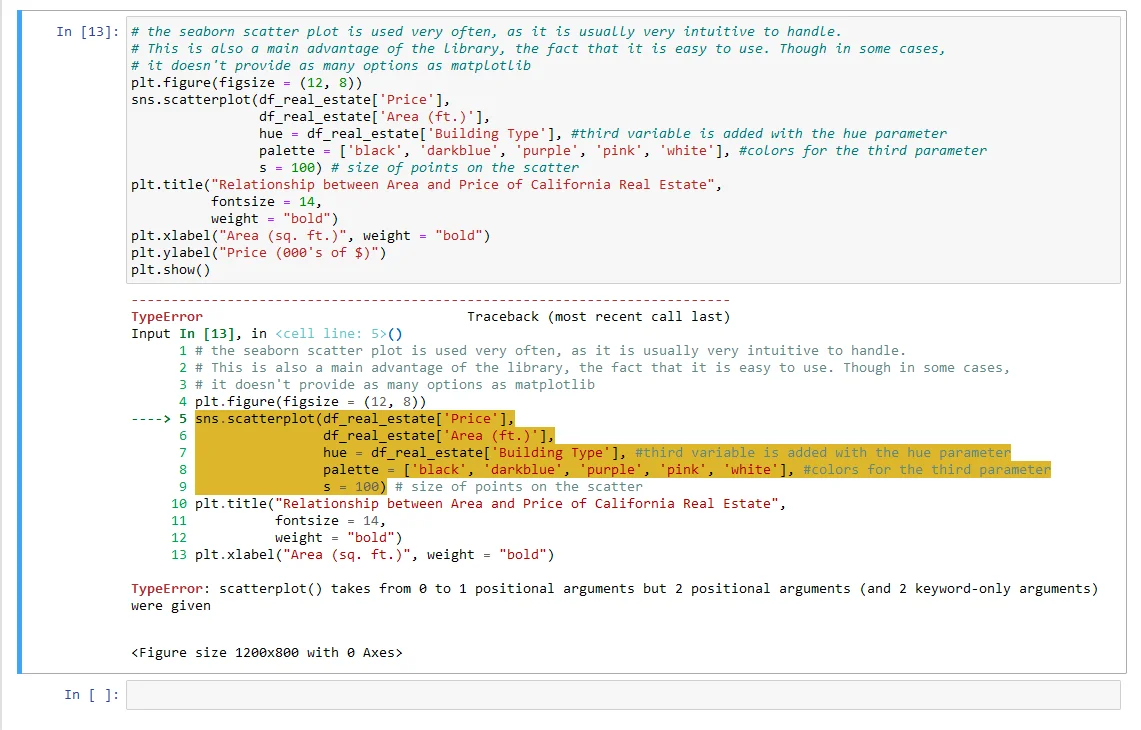
The code for the sns portion needs to be updated. The following error happens when it's run as it is in the video (image with error message).
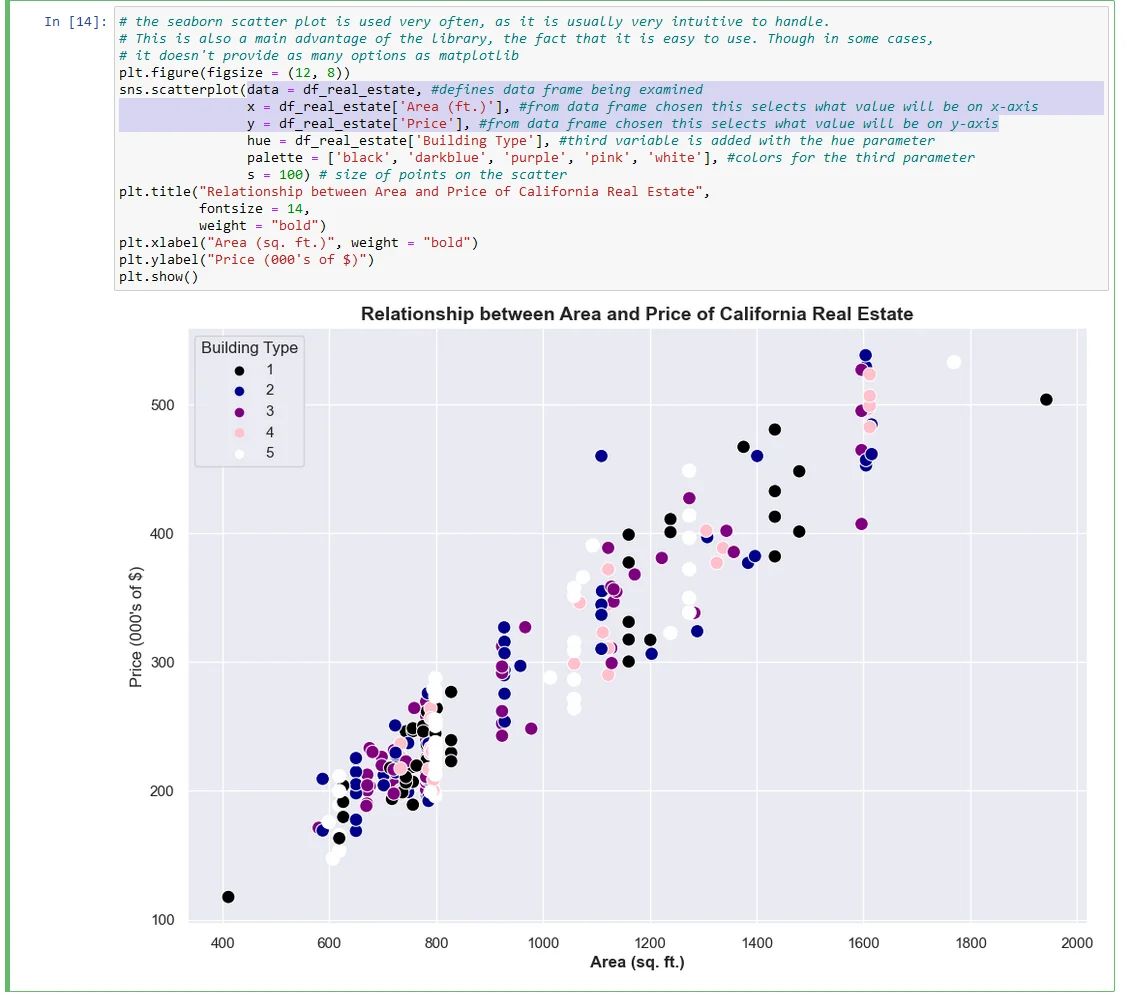
To fix it the following things need to be added to your sns.scatterplot portion to fix the issue that comes up
2 answers ( 0 marked as helpful)
Helpful tip, thanks for sharing
That is super helpful for my output that has warning, now the warning is gone :) thank You!
Submit an answer
related questions
Warning: WARNING: Rtools is required to build R packages but is not currently installed. Please down