• Learn
    • Courses
    • Career Tracks
    • Upcoming Courses
  • Certificates
    • Career Track Certificate
    • Course Certificate
  • Resources
    • All Resources
    • Course Notes
    • Templates
    • Infographics
    • Career Guides
    • Practice Exams
    • Blog
    • Success Stories
  • Pricing
  • Business
    • Team Plan
    • Live Trainings
Log In Sign Up
Follow this topic
Share
Thai Truong Duc
Last answered:

08 Nov 2022

Posted on:

07 Nov 2022

1

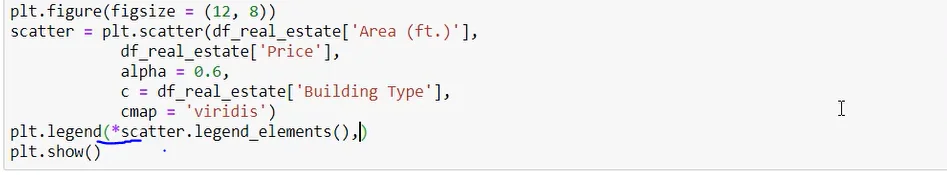
Resolved: why we put an asterisk(*) in the line of code: plt.legend(*scatter.legend_elements())

in The Complete Data Visualization Course with Python, R, Tableau, and Excel / Scatter Plot - Python - How to Create a Scatter Plot
2 answers ( 1 marked as helpful)
Elitsa Kaloyanova
Instructor
Posted on:

07 Nov 2022

0
Helpful answer
Thai Truong Duc
Posted on:

08 Nov 2022

0

Submit an answer

related questions

Valdas Buivydas
0
6
Resolved: Having an error in line 26
Klaudyna Śpiewak-Wojtyła
0
6
Scatter plot video error? The sns graph with wrong labels?
Chukwumaijem Idigo
5
4
Code Update Required
Bernie Tabuzo
0
4
Hi, i can't figure out why 'bar_chart' is not found?
Christian MARQUAY
7
4
plt.savefig() outputs blank image
Bernie Tabuzo
0
4
Hi, i can't figure it out why still isn't successful my location path where i save my bar_chart_data
Roman Collins
0
4
Combo plots part 2- Bar and Line chart in R
Manuel Perez
0
4
Error Code 1146. Table 'sales.employees' does not exist

All the Data Science Courses You Need

About

  • About Us
  • Instructors
  • Contact Us
  • Pricing

Learn

  • Courses
  • Career tracks
  • Career Certificate
  • Course Certificate

Resources

  • Course Notes
  • Templates
  • Career Guides
  • Practice exams
  • Blog

Platform

  • Success stories
  • Q&A Hub
  • Help Center
  • Verify Certificate
© 2023 365 Data Science. All Rights Reserved.
Terms of Use Privacy Policy Cookies