Course Exam Question 15
in
The Complete Data Visualization Course with Python, R, Tableau, and Excel
/
Dashboard in Tableau - Interpretation
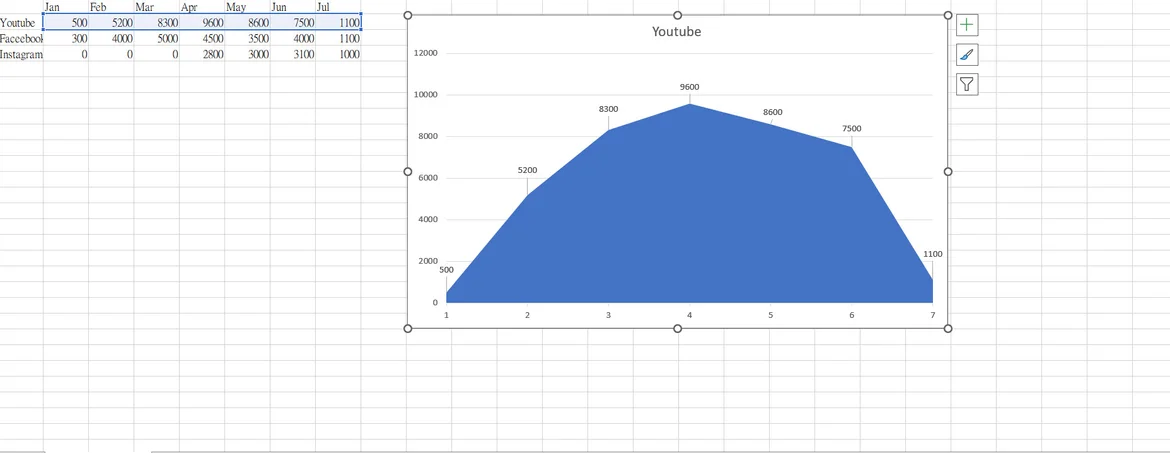
I would like to know that, why the answer is not the first one, since I can create an area chart by using only 1 numerical variable(see the following fig.), I considered it a False statement as well.
Any explaination to this one? Thank you!
best,
Chun
1 answers ( 0 marked as helpful)
Hi Chun,
thanks for reaching out! In your example, I'd argue that you've created an area chart, however the question asks specifically for a stacked area chart, and in your examples there are no categories to be stacked. That's why I'd say that in this case, where we're asking for a stacked area chart, you'd need an additional numerical entity, as well.
Hope this helps!
Best,
365 Eli