Histogram configuration x axis
Hi there, i have been practising histogram on my own with some excerciss from statitics course. So! i want to manipulate better the intervals in order to have my histograms between the intervals i want to show.
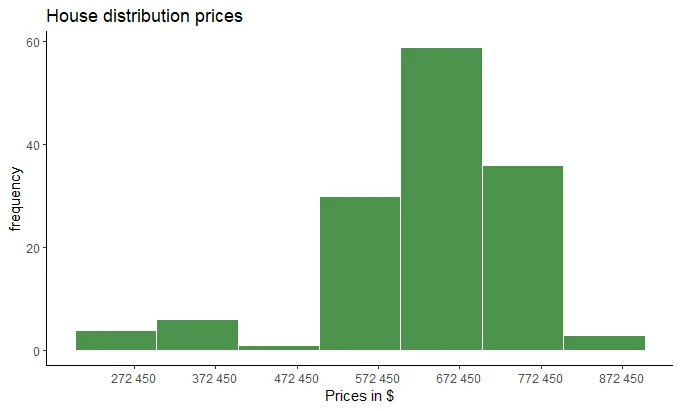
In the histogram attached, you can see that the boundaries of my x axix does not start either at the begining of any of my bars or at the end
I almost never ask in the Q&A but this time i just ran out of options. I hope the question is clear. thanks in advance.
#THIS IS THE CODE USED FOR THE CHART
point <- format_format(big.mark = " ", decimal.mark = ",", scientific = FALSE)

House.hist <- ggplot(House, aes(x = Price))

House.hist +
  geom_histogram(binwidth = 100000, boundary = 0,
                 color = "white", fill = "darkgreen", alpha = 0.7) +
  theme_classic() +
  scale_x_continuous(labels = point,
                     breaks = seq(272450, 972450, 100000)) +
  labs(title = "House distribution prices",
         x = "Prices in $",
         y = "frequency")
Hi Carlos,
thanks for reaching out! I was unable to reproduce your code, for some reason the format_format() function gives me an error, could you please include the libraries you used for the code, ideally if you know where format_format comes from.
Thanks in advance!
Best,
365 Eli
format_format() comes from: Scales package.