Resolved: Histogram creation problem
Hi guys,
It would be better to show somehow the creation process of the histogram. I could not create it. The solution file unfortunately is not helpful.
Hi Tural
you can watch this helpful video
https://www.youtube.com/watch?v=xekiDJzajYk
agree with you ...the video is not informative and lacks a lot of explanations
I agree with others who commented here. Almost every video I've seen here doesn't explain much of anything regarding how to actually reproduce what is shown, which is pretty much the whole point of taking any course. This shouldn't even be an issue. EXTREMELY disappointed with the quality of the instruction and content to this point.
If you are struggling to create a Histogram in the MS Excel. Follow the notes below.
1. It is so simple if you have a dataset, no need to create frequency distribution table.
2. Select the dataset, Go to charts and select histogram.
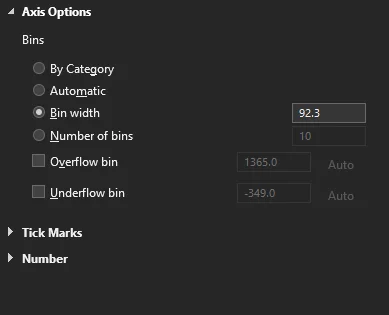
3. In the chart design section - Add chart element - Axes - More Axes options - Enter the bin width.
Note: Please do not use the frequency distribution table to create histogram in MS Excel.
If anyone is using a mac here's a solution if can't edit bin width
https://www.reddit.com/r/excel/comments/inaqic/change_the_number_of_bins_of_a_histogram_on_mac/