Resolved: Task 2 - switch problem
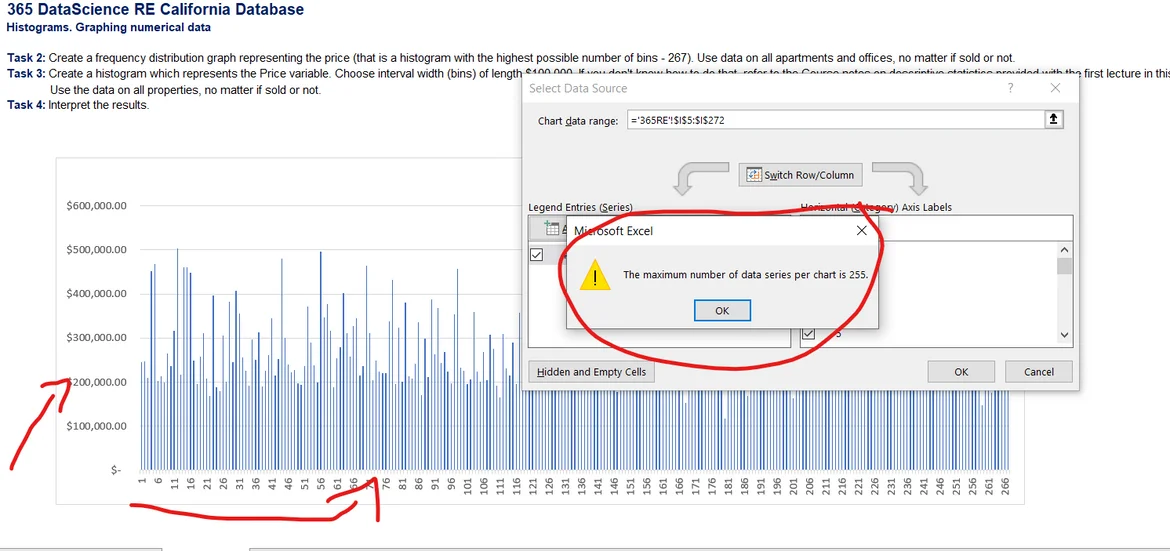
When I try to switch row/column I got this Error !
How can I fix this problem ?
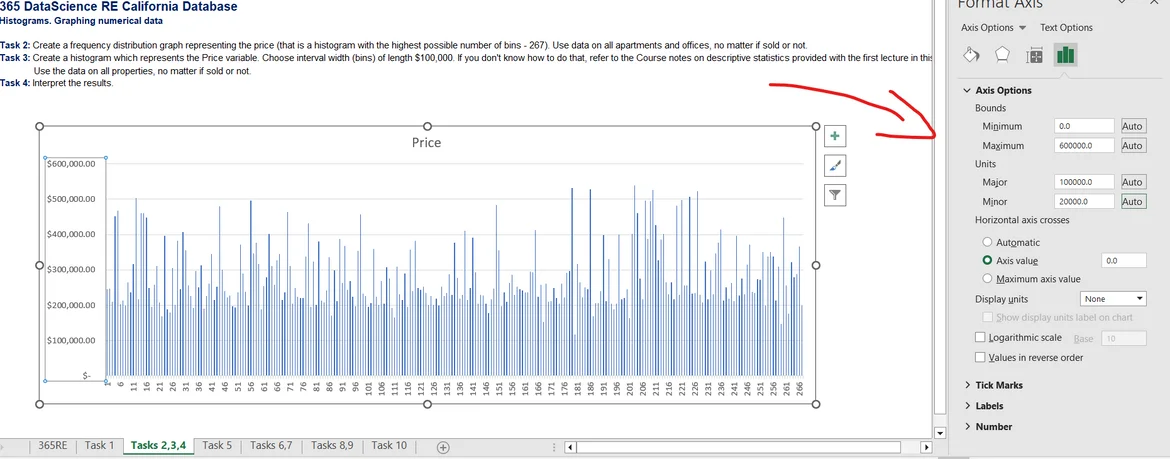
Also I cant find Pin wedth in my Format axis options!
Hi Khaled,
I believe you are tying to replicate the histogram shown in task 2 sheet.
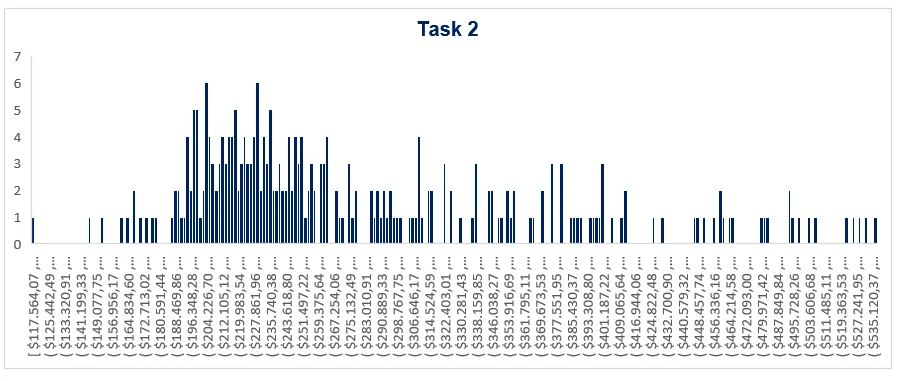
Where y axis represents the frequency and x axis represents the interval. As I saw on your chart, you plotted y as price.
To solve the task you should build the data interval (x) and then apply countfs function to find the frequency (y)
data interval = (Maximum Value - Minimum Value) / Number of elements you want to show
You will find something like this: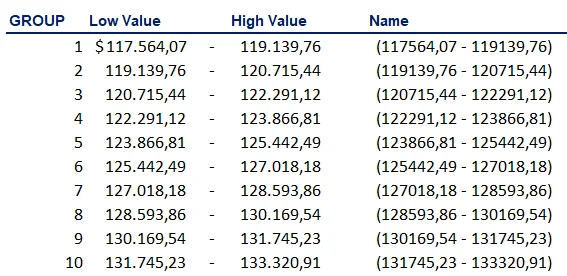
Use the following formula to calculate the frequency:
=COUNTIFS(<PriceInterval>;CONCATENATE(">=";<LowerValue>);<PriceInterval>;CONCATENATE("<";<HigherValue>))
Following theses steps you will see something like this: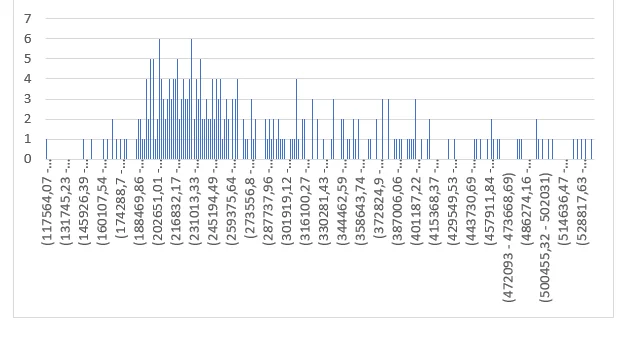
I hope this might help.