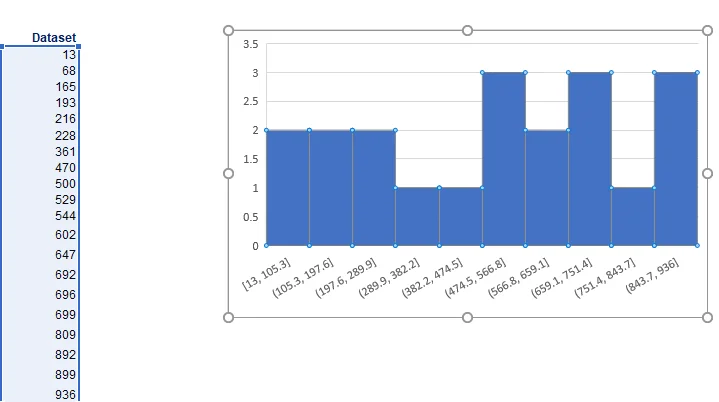
how to include both the interval start and end in the axis's name??? any help!!
Hello Asmaa!
Thanks for reaching out!
Please try the following sequence of commands. Select the data set that consists of numbers from 13 to 936. Then, press Cntr+Q to access the Quick Analysis Toolpak. Go for the Histogram option under the "Charts" category. Depending on your version of Excel, it might be listed under "Recommended Charts" or "All Charts". Once you create the histogram, please right click on the X-axis and go for "Format Axis". This is where you control the bins. In the exercise's case the number of bins should be 10. You can also try playing with the bins and see how this changes the histogram created.
Hope this helps!
Best,
The 365 Team
Thanks a lot for your response, but it partially worked
Hello Asmaa!
Thanks for the quick reply!
Please select the data set on the left (not the one on the right side of the picture that you are showing). Here is a reference on what you should select:
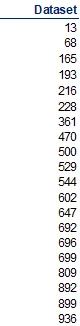
Then, please re-do the trial.
Thanks!
Best,
The 365 Team
thanks a lot. it works