Resolved: Question about Probability Density function (PDF)
Hello every one.
I have a question about the values that the density function of continuous distributions can take.
In the graphical representation, can it take values greater than 1?
Would there be an interpretation to the green line of the graph? Because P( X=x1) = 0 , but ,what interpretation have the abscissa?
Or can only the area be interpreted?
Regards and thank you very much in advance.
The course and the teacher seem fantastic to me.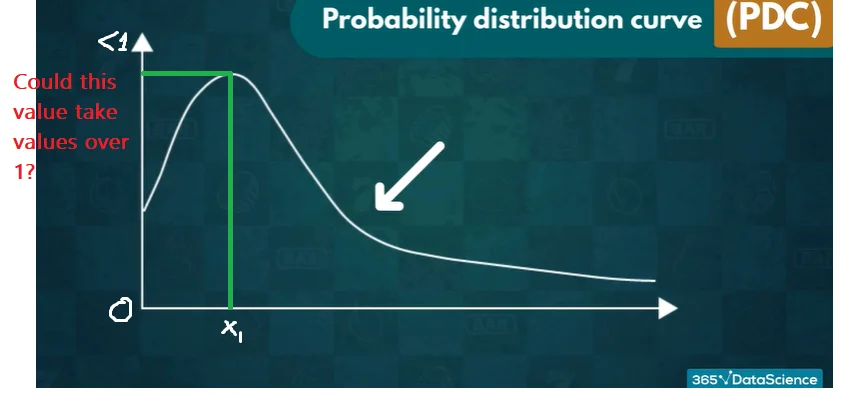
Hey Enrique,
Thank you for reaching out!
The x-axis of a probability distribution curve represents all outcomes of an event. The y-axis, in turn, represents the probability of each outcome occuring. Therefore, the height of the graph cannot go beyond 1. Additionally, the sum of the probabilities of all outcomes - that is, the area under the curve - should equal 1. As discussed in the lecture, integration allow you to calculate the probability of a set of outcomes.
Hope this helps!
Kind regards,
365 Hristina
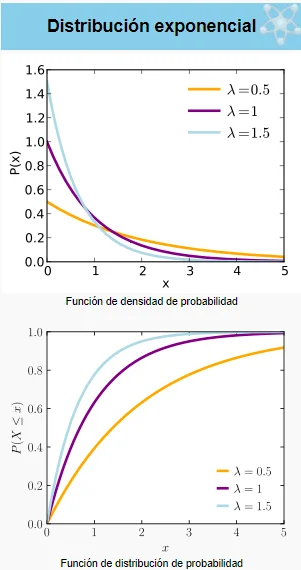
Hello, thanks for your quick response, I found in the documentation that in the density function (continuous distributions) the y axis can take values greater than 1.
Because the density function does not represent probability, the probability density in an infinitesimal interval of x.
Being - - > Density = (probability of the interval) / (length of the interval).
Is this true
Hey again Enrique,
Can you tell me which documentation you are referring to?
Thank you!
Kind regards,
365 Hristina
Hi Hristina.
i found it in spanish text.
But you can see on the graph of the exponential function on wikipedia. In the attached image, you can see PDF takes values greater than 1.
Thanks