The word standardization may sound a little weird at first but understanding it in the context of statistics is not brain surgery. It is something that has to do with distributions. In fact, every distribution can be standardized. Say the mean and the variance of a variable are mu and sigma squared respectively. Standardization is the process of transforming a variable to one with a mean of 0 and a standard deviation of 1.
You can see how everything is denoted below along with the formula that allows us to standardize a distribution.

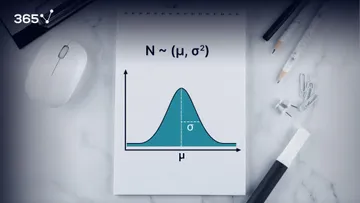
Standard Normal Distribution in Statistics: Definition and Formulas
Logically, a normal distribution can also be standardized. The result is called a standard normal distribution.

You may be wondering how the standardization goes down here. Well, all we need to do is simply shift the mean by mu, and the standard deviation by sigma.

We use the letter Z to denote it. As we already mentioned, its mean is 0 and its standard deviation: 1.

The standardized variable is called a z-score. It is equal to the original variable, minus its mean, divided by its standard deviation.

A Case in Point
Let’s take an approximately normally distributed set of numbers: 1, 2, 2, 3, 3, 3, 4, 4, and 5.

Its mean is 3 and its standard deviation: 1.22. (You can quickly compute them by inputing the data into our mean and standard deviation calculators.) Now, let’s subtract the mean from all data points.
As shown below, we get a new data set of: -2, -1, -1, 0, 0, 0, 1, 1, and 2.

The new mean is 0, exactly as we anticipated.

Showing that on a graph, we have shifted the curve to the left, while preserving its shape.
The Next Step of the Standardization
So far, we have a new distribution. It is still normal, but with a mean of 0 and a standard deviation of 1.22. The next step of the standardization is to divide all data points by the standard deviation. This will drive the standard deviation of the new data set to 1.
Let’s go back to our example.
The original dataset has a standard deviation of 1.22. The same goes for the dataset which we obtained after subtracting the mean from each data point.

Important: Adding and subtracting values to all data points does not change the standard deviation.
Now, let’s divide each data point by 1.22. As you can see in the picture below, we get: -1.6, -0.82, -0.82, 0, 0, 0, 0.82, 0.82, and 1.63.

If we calculate the standard deviation of this new data set, we will get 1.
And the mean is still 0!

In terms of the curve, we kept it at the same position, but reshaped it a bit, as shown below.

Standardization of Normal Distribution: Next Steps
This is how we can obtain a standard normal distribution from any normally distributed data set.
Using it makes predictions and inferences much easier. This is exactly what will help us a great deal in the next tutorials. So, if you want to use the knowledge you gained here, feel free to jump into the linked tutorial.
***
Interested in learning more? You can take your skills from good to great with our statistics course!
Try statistics course for free
Next Tutorial: Getting Familiar with the Central Limit Theorem and the Standard Error