What Is a Distribution?
In statistics, when we use the term distribution, we usually mean a probability distribution.
Good examples are the normal distribution, the binomial distribution, and the uniform distribution.

If this is your first time hearing the word distribution, don’t worry. Let’s just say that after reading this tutorial, you will have a higher chance of winning any game that involves rolling a die. To get a better understanding of what it is all about, we should start with a definition.
A distribution is a function that shows the possible values for a variable and how often they occur.
Discrete Uniform Distribution Example
Think about a fair die.

It has six sides, numbered from 1 to 6. Imagine that we roll the die. What is the probability of getting 1?
It is one out of six, so it must be one-sixth.

Try guessing what the probability of rolling a 2 is. Once again - one-sixth. The same holds true for 3, 4, 5 and 6.
We have an equal chance of getting each of the 6 outcomes.

Now, what do you think is the probability of getting a 7?
It is impossible to get a 7 when rolling a single die.

Therefore, the probability is 0.

The Values that Make up a Distribution
Let’s generalize. The distribution of an event consists not only of the input values that can be observed. It is actually made up of all possible values. So, the distribution of the event - rolling a die - will be given by the following table.

The probability of getting 1 is one-sixth, or 0.17. The probability of getting 2 is also 0.17, and so on.
How to Tell if We Have Gone Through all Possible Values
We are sure that we have exhausted all possible values when the sum of their probabilities is equal to 1 or 100%.

Similar to what we discussed about getting a 7, for all other values, the probability of occurrence is 0.
And that’s the probability distribution of rolling a die. By the way, it is called a discrete uniform distribution. All outcomes have an equal chance of occurring.
The Visual Representation
Each probability distribution has a visual representation. It is a graph describing the likelihood of occurrence of every event. You can see the graph of our example in the picture below.

Important: It is crucial to understand that the graph is JUST a visual representation of a distribution.
Often, when we talk about distributions, we make use of the graph. That’s why many people believe that a distribution is the graph itself. However, this is NOT true. A distribution is defined by the underlying probabilities and not the graph. The graph is just a visual representation.

After this short clarification, let’s explore a different example.
Discrete Uniform Distribution: Another Case in Point
Think about rolling two dice.
What are the possible outcomes?
1 and 1, 2 and 1, 1 and 2, and so on.
In the picture below, you can see a table with all the possible combinations.

Say we are playing a game where we are trying to guess the sum of the two dice.
Can you guess the probability of getting a sum of 1? It’s 0, as this event is impossible.

The Smallest Sum Possible
The minimum sum we can get is 2. So, what’s the probability of getting a sum of 2? There is only one combination that would give us a sum of 2 – when both dice are equal to 1.
So, 1 out of 36 total outcomes, or 0.03.

Similarly, the probability of getting a sum of 3 is given by the number of combinations that give a sum of 3 divided by 36. If you think about it, 1 and 2, and, 2 and 1 are the only possibilities. Therefore, the probability is equal to 2 divided by 36. Or simply 0.06.

The Graph Associated with the Distribution
We can continue in this way until we have the full probability distribution.

The graph associated with it is shown below.

Looking at it we can easily understand that when rolling two dice, the probability of getting a 7 is the highest.

Moreover, we can also compare different outcomes such as the probability of getting a 10 and the probability of getting a 5.

As you can tell from the picture above, it’s less likely that we’ll get a 10.
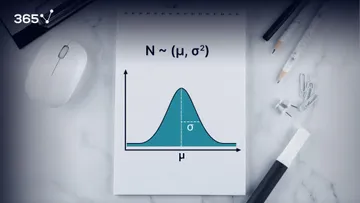
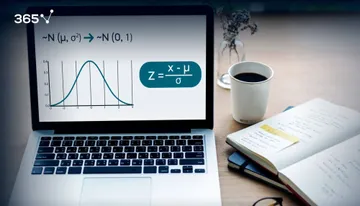
Next Steps: Normal Distribution
To sum up, there are various types of distributions. Usually, we will use a graph to visualize them. The examples that we discussed, were of discrete variables. However, they are not as common in inferences as the continuous distributions. The journey where we will be exploring them starts off with the Normal distribution.
***
Interested in learning more? You can take your skills from good to great with our probability course! Try probability course for free!
Next Tutorial: Introducing the Normal Distribution