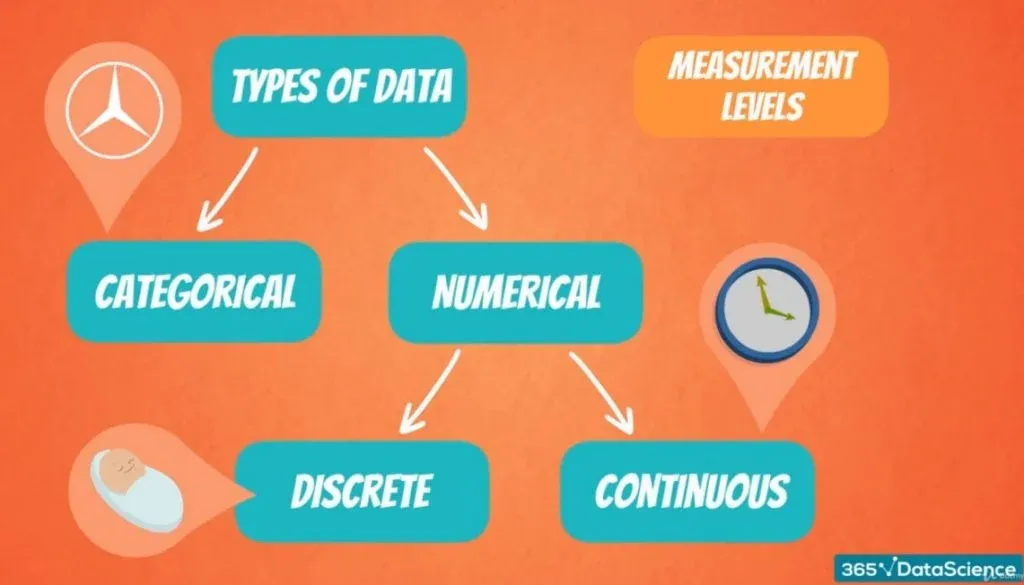
We can classify data in two ways: based on its type and on its levels of measurement. If you want to figure out how to do it based on its type, that’s something we covered in this tutorial.
We've also made a video on the topic. You can watch it below or scroll down if you prefer reading.
Levels of Measurement: Qualitative and Quantitative Data
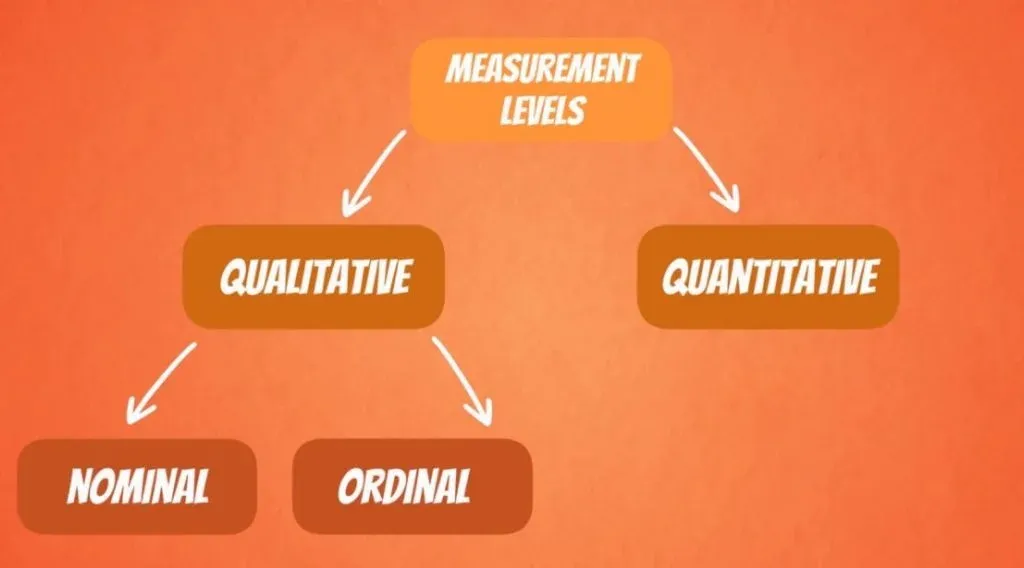
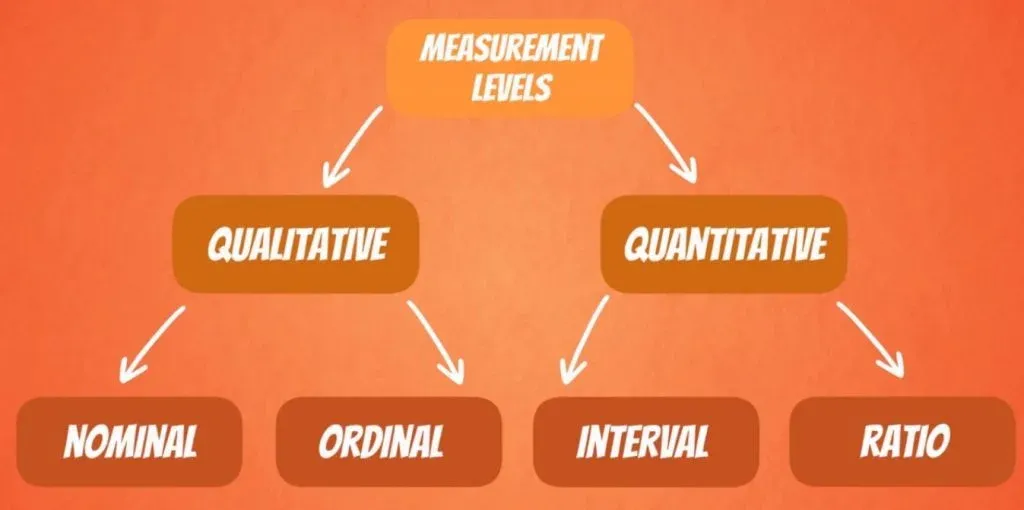
Now, it’s time to move onto the other classification – levels of measurement. These can be split into two groups: qualitative and quantitative data.
They are very intuitive, so don’t worry.
Qualitative Data
Qualitative data can be further divided into nominal and ordinal.
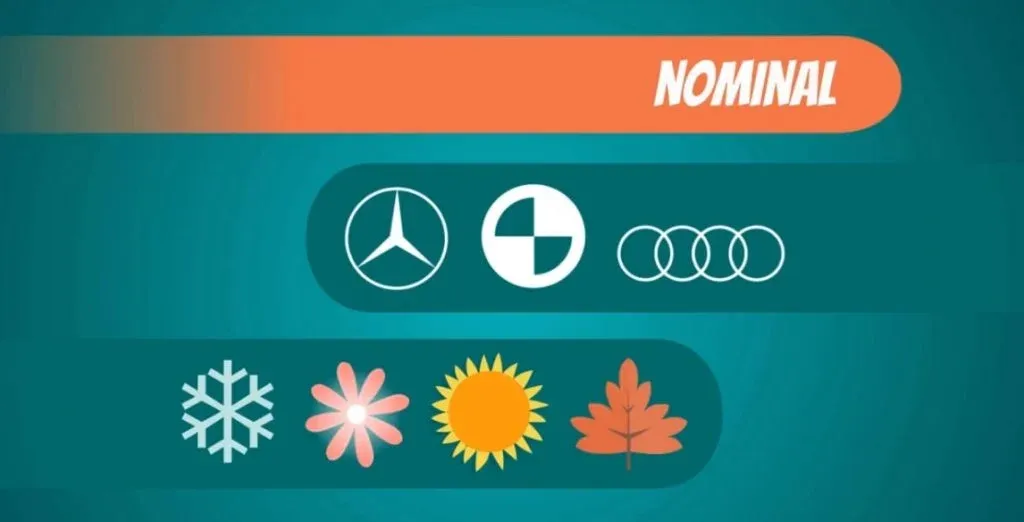
Nominal variables are categories like car brands – Mercedes, BMW or Audi, or like the four seasons – winter, spring, summer and autumn. They aren’t numbers and cannot be ordered.
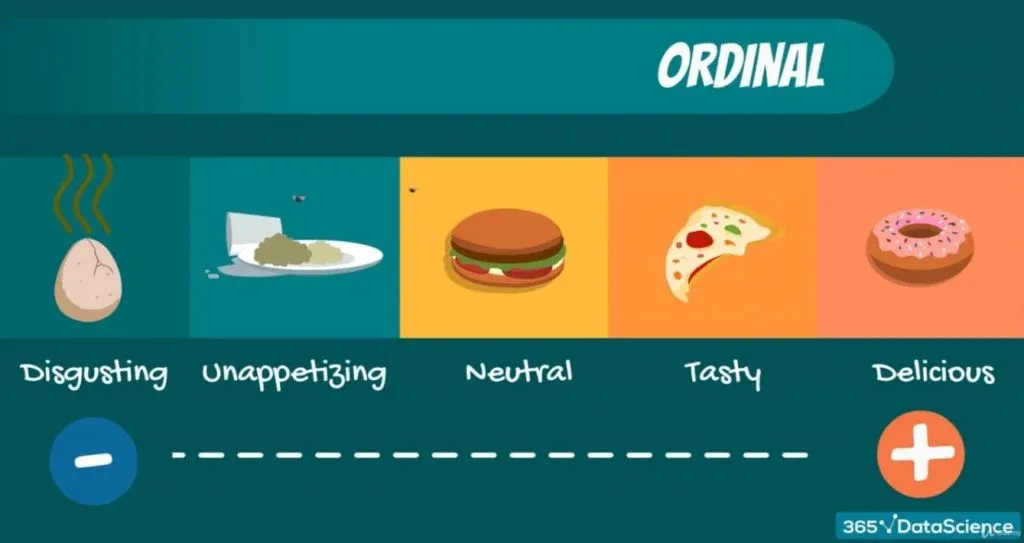
Ordinal data, on the other hand, consists of groups and categories which follow a strict order. Imagine you have been asked to rate your lunch and the options are: disgusting, unappetizing, neutral, tasty, and delicious. Although we have words and not numbers, it is obvious that these preferences are ordered from negative to positive, thus the level of measurement is qualitative, ordinal.
Quantitative Data
So, what about quantitative variables? Well, as you may have guessed, they are also split into two groups: interval and ratio.
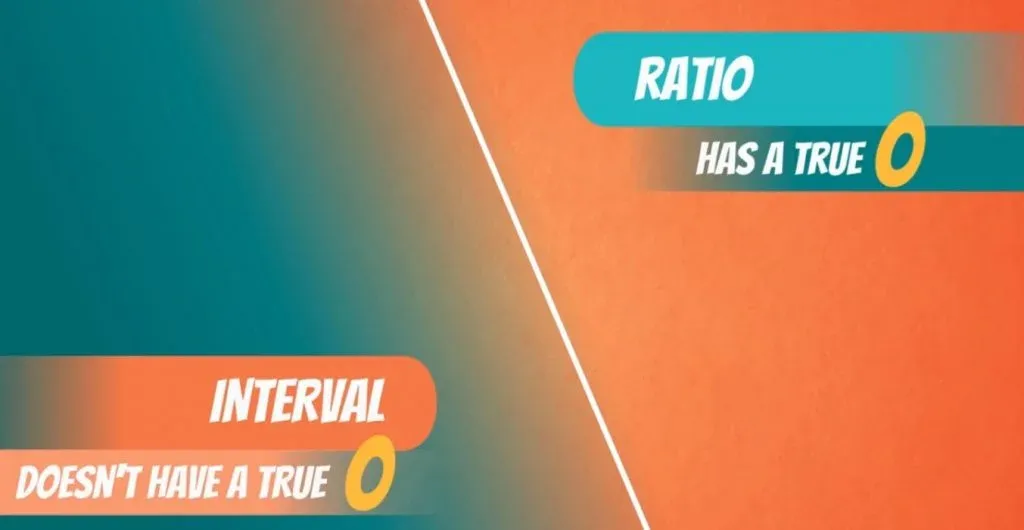
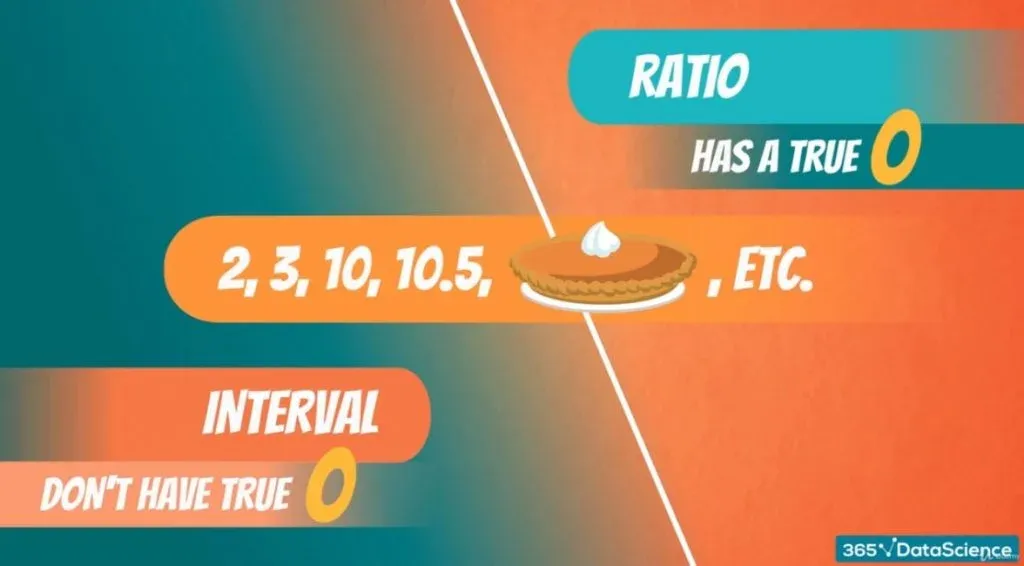
Intervals and ratios are both represented by numbers but have one major difference. Ratios have a true zero and intervals don’t.
Ratios
Most things we observe in the real world are ratios. Their name comes from the fact that they can represent ratios of things.
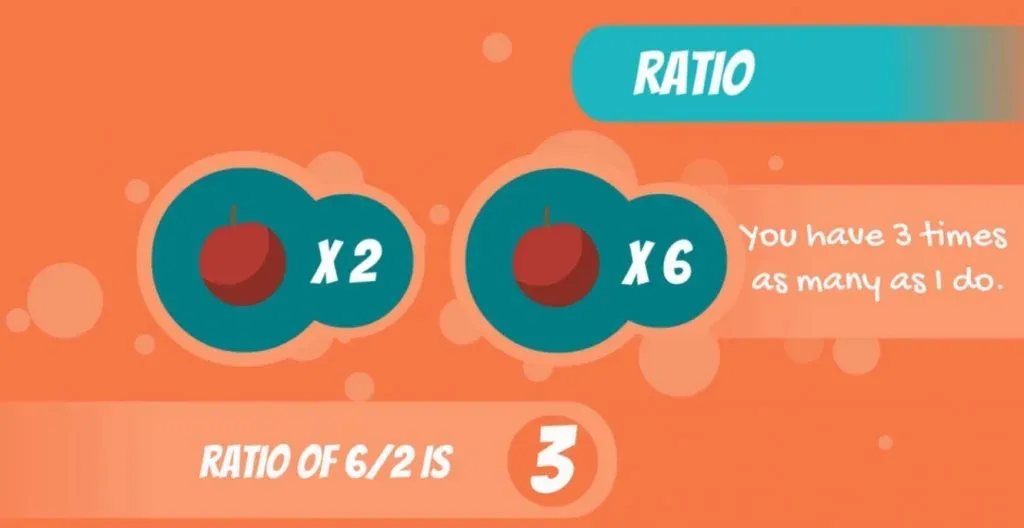
For instance, if I have 2 apples and you have 6 apples, you would have 3 times as many as I do. How did I find that out? Well, the ratio of 6 and 2 is 3.
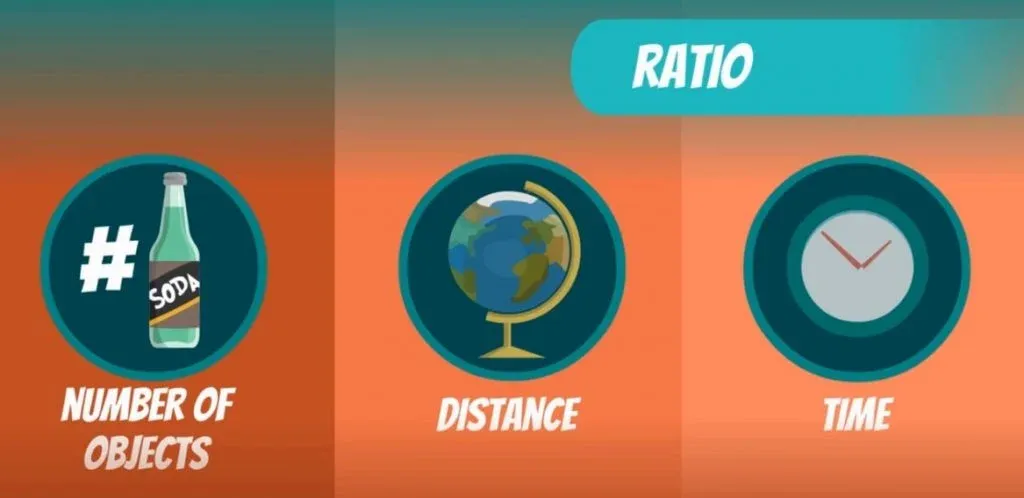
Other examples are a number of objects in general, distance and time.
Intervals
Intervals are not as common. Temperature is the most common example of an interval variable. Important: It cannot represent a ratio of things and doesn’t have a true 0.
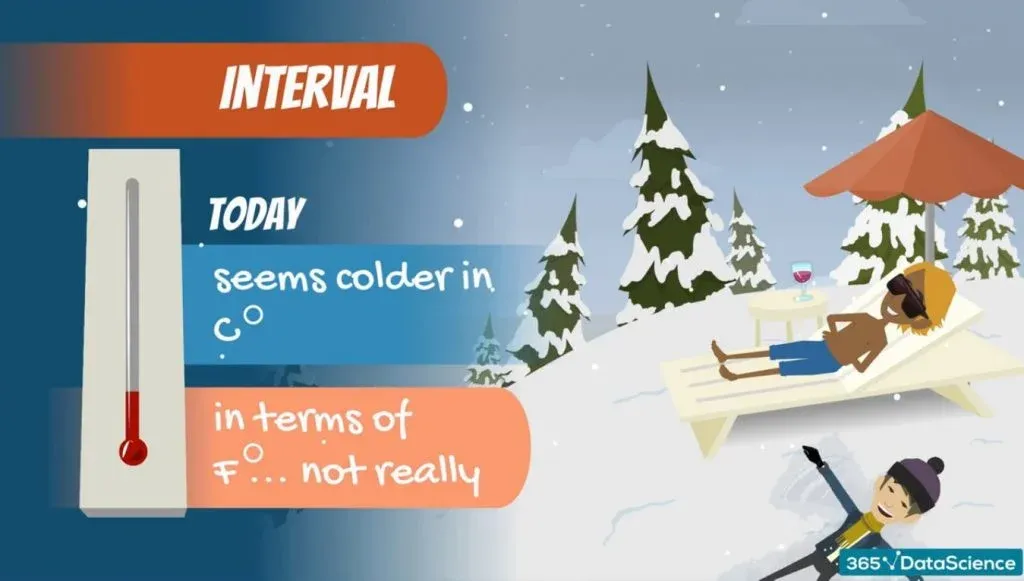
For instance, temperature is usually expressed in Celsius or Fahrenheit. They are both interval variables. Say today is 5 degrees Celsius, or 41 degrees Fahrenheit. And yesterday was 10 degrees Celsius, or 50 degrees Fahrenheit.
In terms of Celsius, it seems today is twice colder, but in terms of Fahrenheit - not really.
The Issue
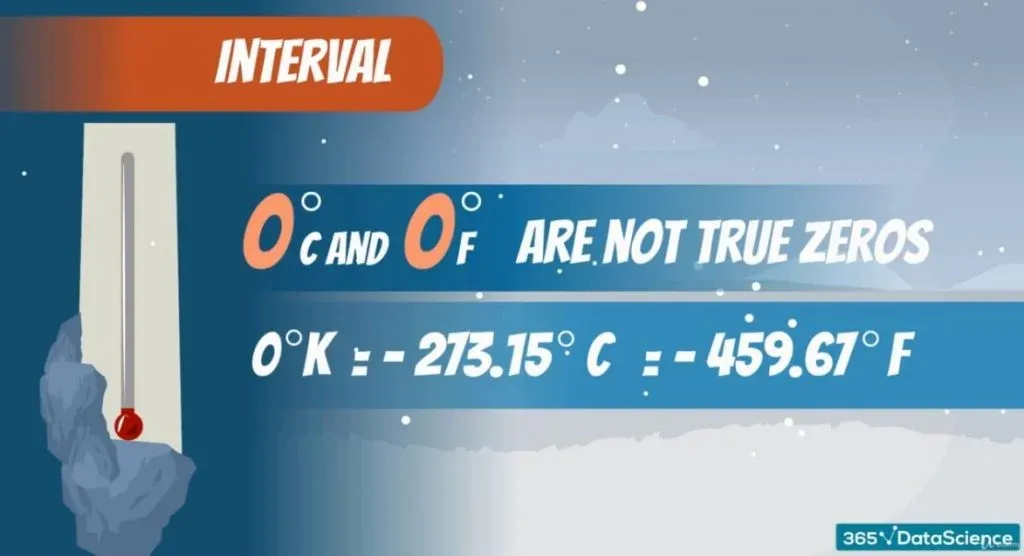
The issue comes from the fact that 0 degrees Celsius and 0 degrees Fahrenheit are not true 0s. These scales were, artificially created by humans for convenience.
Now, there is another scale, called Kelvin, which has a true 0. 0 degrees Kelvin is the temperature at which atoms stop moving and nothing can be colder than 0 degrees Kelvin. This equals -273.15 degrees Celsius, or -459.67 degrees Fahrenheit.
Variables shown in Kelvin’s are ratios, as we have a true 0, and we can make the claim that one temperature is 2 times more than another. Celsius and Fahrenheit have no true 0 and are intervals.
Side note: Numbers like 2, 3, 10, 10.5, 3.14(Pi) can be both interval or ratio. However, you have to be careful with the context you are operating in.
The Different Levels of Measurement
To conclude, the levels of measurement can be either qualitative or quantitative. Qualitative data is split into two, as well. It can be nominal or ordinal, depending if there is any strict order or not. Quantitative data also consists of 2 groups – ratios and intervals. Here, the key difference is whether or not there is a true 0.
So, now that you know all levels of measurement, you will be able to move onto deeper statistics subjects. Understanding how to visualize data seems like the perfect beginning to that journey.
***
Interested in learning more? You can take your skills from good to great with our statistics tutorials and Statistics course.
Next Tutorial: Visualizing Data with Bar, Pie and Pareto Charts

