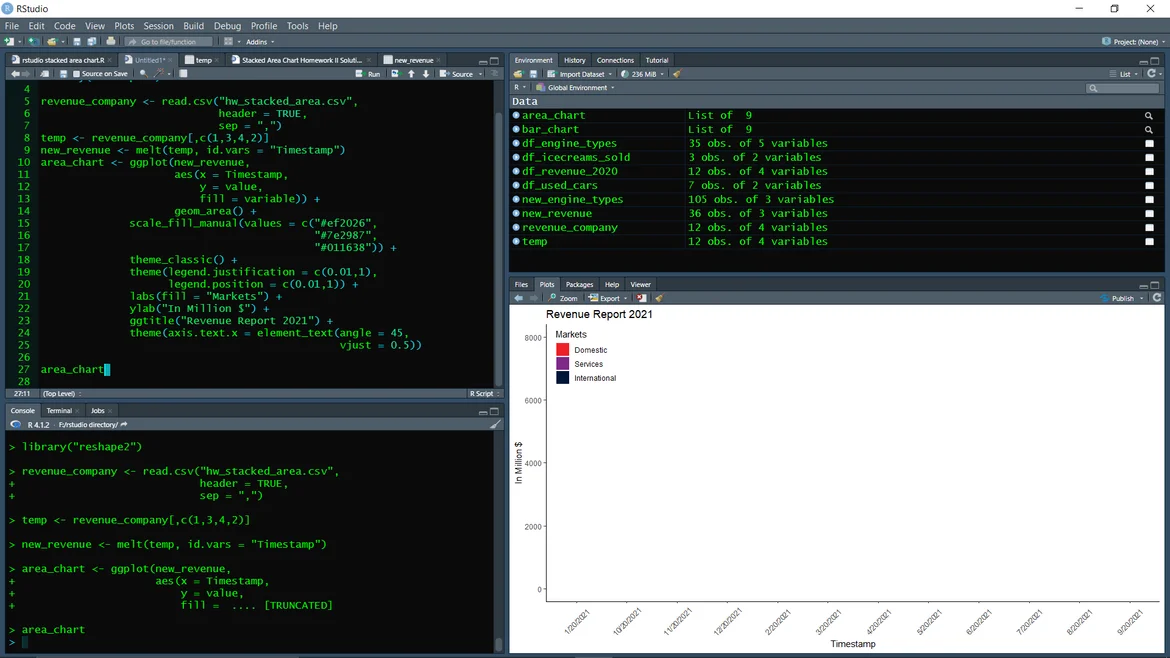
area chart not showing up in rstudio
I typed in everything which was shown in the solution (I think) but the chart is still not being displayed some help will be appreciated!
Hi Rohan,
thanks for reaching out! What you could try to find the problem here is to create the very basic area chart first and see if the data is displayed to narrow down the problem area. If the basic area chart appears, then you can add the next elements like a new theme and custom colors and so on.
Hope this helps!
Best,
365 Eli
Hi Elitsa
I'm not incredibly R-savvy (hence, doing this course) - what I think is going on is that the date format is not being recognised properly.
In response to the scale_x_continuous(breaks = stacked_data$Date) I get the error message
Error: Discrete value supplied to continuous scale
and if you'd kindly look at the order of the dates on the x-axis in the original question, you'll see that they're out of proper order.
I do not know how to fix this without modifying the original file.
Best, Elise
Hi Elise,
yes, working with time series data is always tricky! In the stacked area chart lesson, we omit this part and use only the year a car has been manufactured. In the following section about line charts we talk about how to modify the date in the desired format(around 0:50 in the video):
The Complete Data Visualization Course with Python, R, Tableau, and Excel | 365 Data Science
Let me know if this works!
Best,
365 Eli
Hi Elitsa,
Due to unfortunate circumstances I've been away from my computer for over a week. I've come back to my R script and it's working fine now, so I'm not sure what I did at the time before I saw your reply. (I had since done the line chart lesson section, which was very useful, thank you.)
Sorry this isn't helpful info, I just didn't want to leave you hanging :)
Best, Elise