Continuous Distribution Quiz Question #6
Hello team,
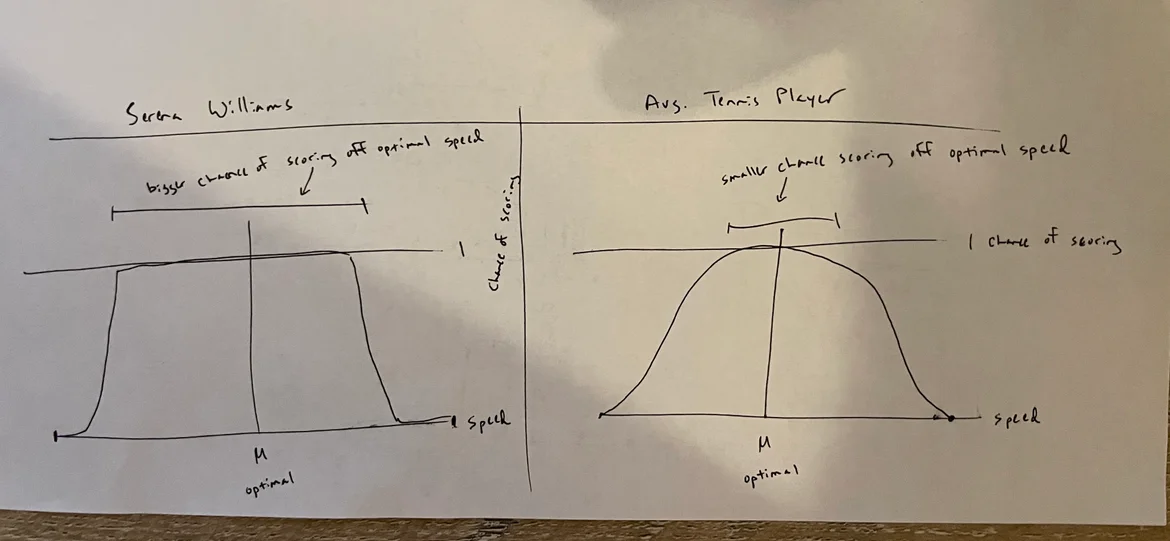
Can you please double check the answer and the explanation to this question? I'm not sure the answer follows from the question. Based on the lectures, I was understanding that a smaller scale leads to a pdf that is more tightly clustered around the mean, which is the optimal speed of a shot. But a more spread out graph means that as someone's shot differs from the optimal speed, the chances of them scoring decreases. I'm attaching a picture of what I'm imagining for Serena Williams vs an avg tennis player based on the info in the lectures. Please tell me if this is correct or not.
Thanks!
-Justin
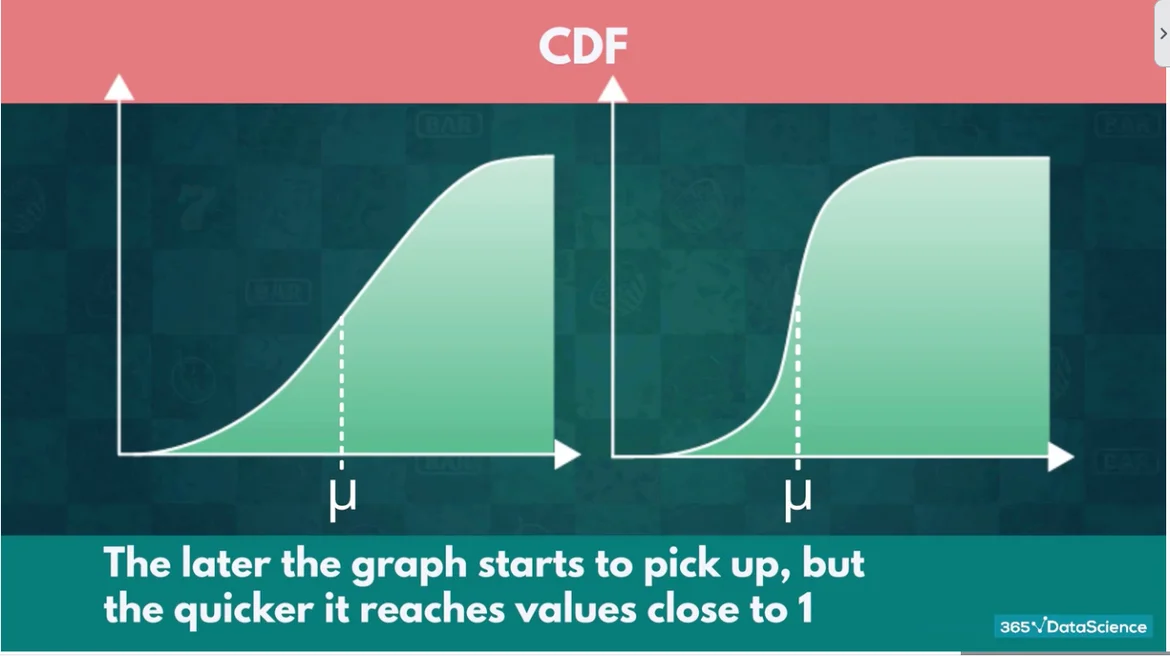
Here is a screenshot of the course explaining scale. To me, it looks like the small scale corresponds to Serena Williams's graph in my drawing above. This is why the explanation to the quiz question does not make sense to me.

Can you please double check the answer and the explanation to this question? I'm not sure the answer follows from the question. Based on the lectures, I was understanding that a smaller scale leads to a pdf that is more tightly clustered around the mean, which is the optimal speed of a shot. But a more spread out graph means that as someone's shot differs from the optimal speed, the chances of them scoring decreases. I'm attaching a picture of what I'm imagining for Serena Williams vs an avg tennis player based on the info in the lectures. Please tell me if this is correct or not.
Thanks!
-Justin

Here is a screenshot of the course explaining scale. To me, it looks like the small scale corresponds to Serena Williams's graph in my drawing above. This is why the explanation to the quiz question does not make sense to me.

0 answers ( 0 marked as helpful)