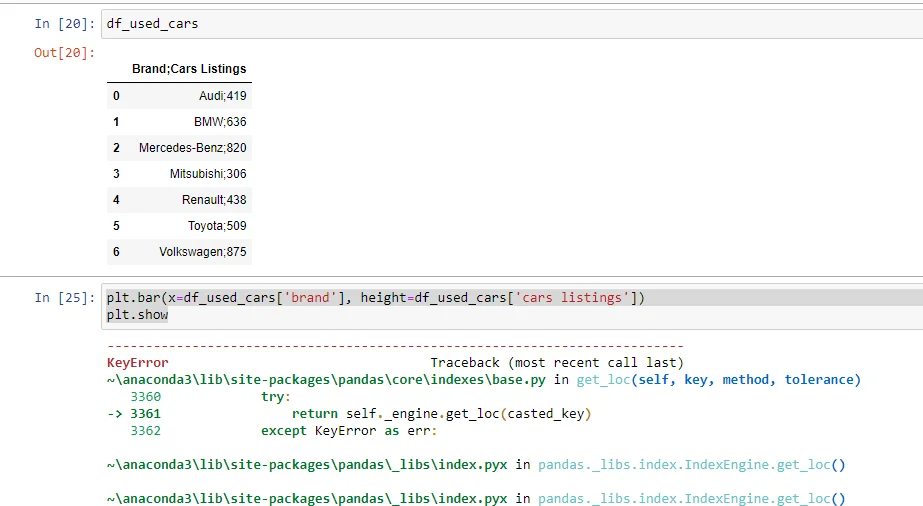
I can't get the table's columns separated which caused an error after writing the show code
in
The Complete Data Visualization Course with Python, R, Tableau, and Excel
/
Bar Chart - Python - How to Create a Bar Chart
1 answers ( 0 marked as helpful)
Hi Asmaa,
thanks for reaching out! Could you try adding the following addition to your code when you're reading the csv file:
df_used_cars = pd.read_csv("bar_chart_data.csv", sep = ";")
This basically tells the reader to split the entries into separate columns, everytime it encounters the ";", which I believe is the issue in this case.
Let me know if you have any issues with reading the file and creating the plot!
Best,
365 Eli
Submit an answer
related questions
Hi, i can't figure it out why still isn't successful my location path where i save my bar_chart_data