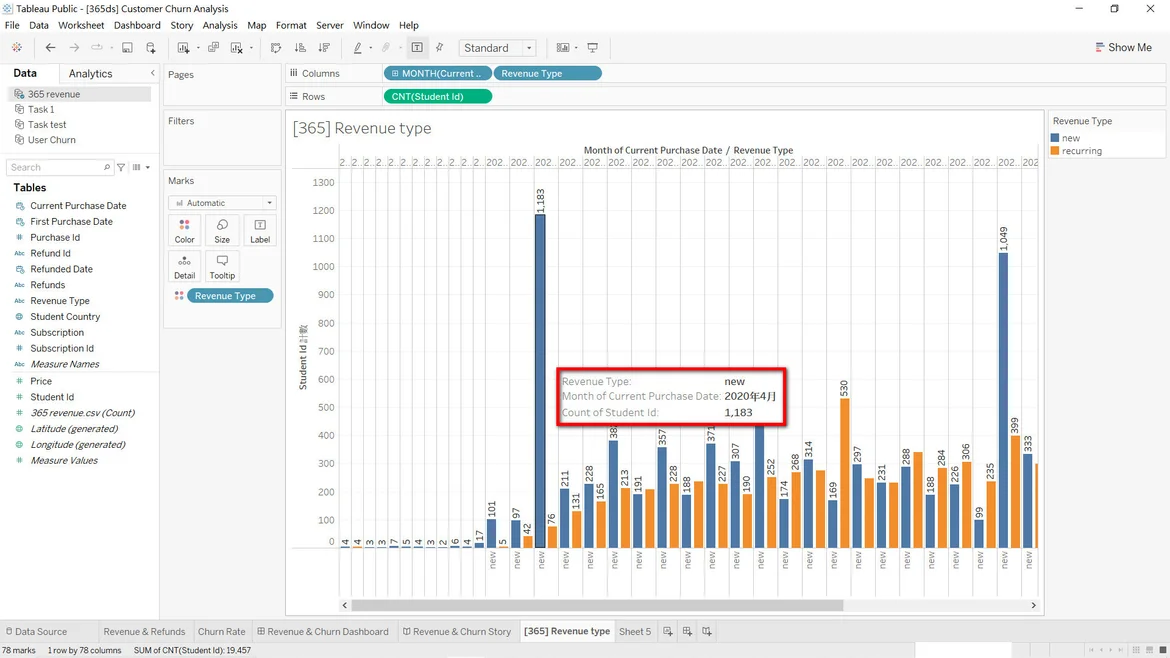
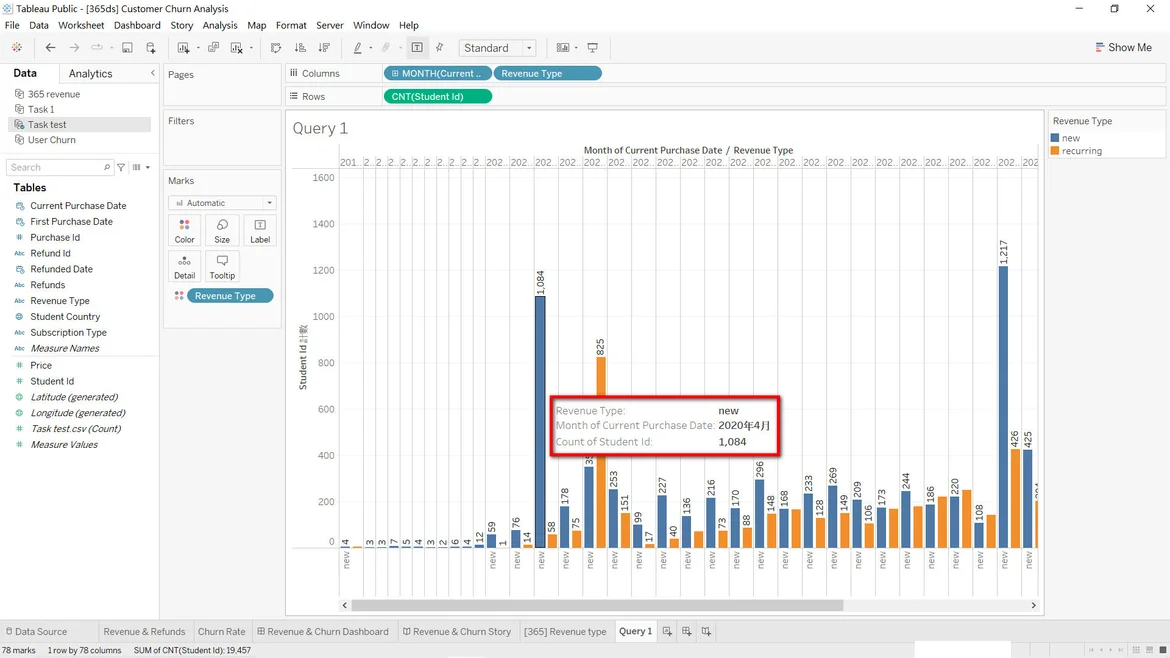
Mismatched data in col of "revenue_type"
Dear 365datascience,
The total count number of "student_id" by month shown in this video is exactly the same as you teach in the
Lecture: Query1 - Net Revenue, but after seperating by "revenue_type",
I'll get a different result due to some missmatched data in col of "revenue_type" within CSV file.
Would you mind checking it out for me?
Thank you!


Hi Chun,
thanks for reaching out!
I'm having a little trouble understanding where the difference in numbers comes from? Could you expand a bit further on your approach and how it's different from the course. From what I see in the code you've outlined, there seems to be no differences?
Thanks in advance!
Best,
365 Eli
Hi Elitsa,
Sorry for the confusing here. What I do is, I copy all the code from the resources you provided("MySQL revenue query") in Lecture: how to export data from workbench, then creat that bar chart based on the output of CSV file. As you can see, that bar chart is not the same as you created in the Lecture: New vs Recurring Revenue - Combination Charts In Tableau. For example, in the month of 04/2020, the number of new student_id is 1,084 in that chart, but 1,183 in your chart created from "revenue CSV" file which you provided as well in the resources. There're some missmatched data in col of "revenue_type" I found, which might be the reason why.
Again, thanks for your reply!
Best,
Chun
Hi Eli,
I think this problem is solved in my newst post
("Purchase date of new & recurring") in your lecture Q&A:
"Query 1 - Net Revenue"
As I stated in that post, if I modify your query in the "revenue_type" clause and export the result as a CSV file, there're no more mismatched data as posted in here. I'll get the same graph in Tableau!
Make sure you see that one.
Thank you!
Hi Chun,
thanks for the heads up and I'm glad you've found a solution to the problem! It would be useful for other students who encounter a similar problem, as well.
Best,
365 Eli