Sierpinski line graph issue
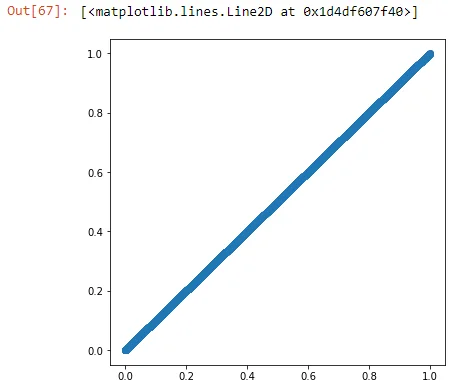
Why do I get a line graph?
1 answers ( 0 marked as helpful)
Hey Petar,
Thank you for your question!
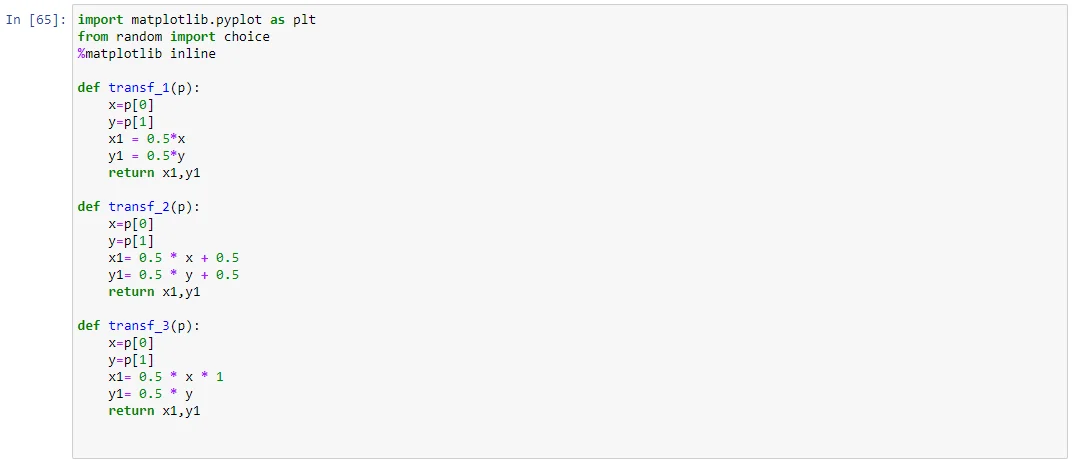
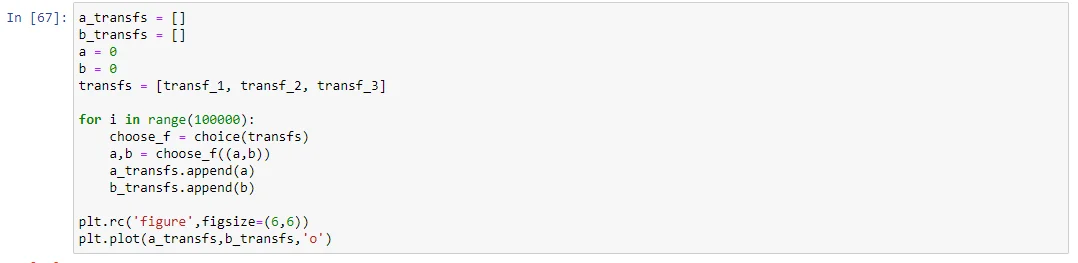
In your transf_3(p) function, you seem to have put a multiplication sign rather than a plus sign before the 1. Note also that the a1 and b1 lists in Giles' code are not initially empty but store a 0. These lists correspond to a_transfs and b_transfs in your code.
Hope this helps and keep up the good work!
Kind regards,
365 Hristina