A bit tired of all the calculations that are usually involved with statistics? Learning about the Student’s T distribution will be right up your alley.
So, if you want to understand how it works, you can watch our video below or just scroll down if you prefer reading.
We will begin our journey of understanding it by telling a story about its origin.
The Story about William Gosset
William Gosset was an English statistician who worked for the Guinness Brewery.

He developed different methods for the selection of the best yielding varieties of barley – an important ingredient when making beer. Gosset found big samples tedious. Therefore, he was trying to develop a way to extract small samples but still come up with meaningful predictions.

What's the Origin of the Student’s T Distribution?
He was a curious and productive researcher and published a number of papers that are still relevant today. However, due to the Guinness company policy, he was not allowed to sign the papers with his own name.

Therefore, all of his work was under the pen name: Student.
Later on, a friend of his and a famous statistician, Ronald Fisher, stepped on the findings of Gosset. He introduced the t-statistic and the name that stuck with the corresponding distribution even today is the Student’s T distribution.

The Student’s T Distribution
The Student’s T distribution is one of the biggest breakthroughs in statistics, as it allowed inference through small samples with an unknown population variance. This setting can be applied to a big part of the statistical problems we face today.

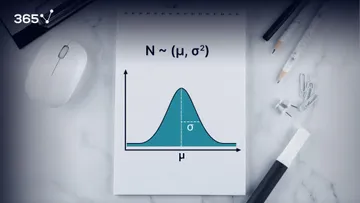
Visually, the Student’s T distribution looks much like a Normal distribution but generally has fatter tails. Fatter tails, as you may know, allow for a higher dispersion of variables, as there is more uncertainty.

The z-statistic
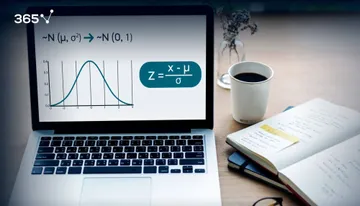
In the same way that the z-statistic is related to the standard Normal distribution, the t-statistic is related to the Student’s T distribution. The formula that allows us to calculate it is: t with n-1 degrees of freedom and a significance level of alpha equals the sample mean minus the population mean, divided by the standard error of the sample.

As you may realize, it is very similar to the z-statistic. After all, this is an approximation of the Normal distribution.

Degrees of Freedom
The last characteristic of the Student’s T-statistic is that there are degrees of freedom. Usually, for a sample of n, we have n-1 degrees of freedom. So, for a sample of 20 observations, the degrees of freedom are 19.

Much like the standard Normal distribution table, we also have a Student’s T table. You can see it in the picture below. The rows indicate different degrees of freedom, abbreviated as d.f., while the columns – common alphas. Alternatively, an easier way to find this value is to use a degrees of freedom calculator for any test, including t-test and z-test.
Please note that after the 30th row, the numbers don’t vary that much. Actually, after 30 degrees of freedom, the t-statistic table becomes almost the same as the z-statistic.

As the degrees of freedom depend on the sample, in essence, the bigger the sample, the closer we get to the actual numbers. A common rule of thumb is that for a sample containing more than 50 observations, we use the z-table instead of the t-table.
New Concept
Now, you know how the Student’s T distribution works. Combined with all the knowledge from our other tutorials on statistics, you are ready to take on a greater challenge. We are talking about one of the fundamental tasks in statistics - hypothesis testing.
***
Interested in learning more? You can take your skills from good to great with our statistics course!
Try statistics course for free
Next Tutorial: Hypothesis Testing: Null Hypothesis and Alternative Hypothesis