The sum of squares is a statistical measure of variability. It indicates the dispersion of data points around the mean and how much the dependent variable deviates from the predicted values in regression analysis.
We decompose variability into the sum of squares total (SST), the sum of squares regression (SSR), and the sum of squares error (SSE). The decomposition of variability helps us understand the sources of variation in our data, assess a model’s goodness of fit, and understand the relationship between variables.
We define SST, SSR, and SSE below and explain what aspects of variability each measure. But first, ensure you’re not mistaking regression for correlation.
Table of Contents
- SST, SSR, SSE: Definition and Formulas
- The Confusion between the Different Abbreviations
- What Is the Relationship Between SSR, SSE, and SST?
- Next Steps
SST, SSR, SSE: Definition and Formulas
This article addresses SST, SSR, and SSE in the context of the ANOVA framework, but the sums of squares are frequently used in various statistical analyses.
What Is SST in Statistics?
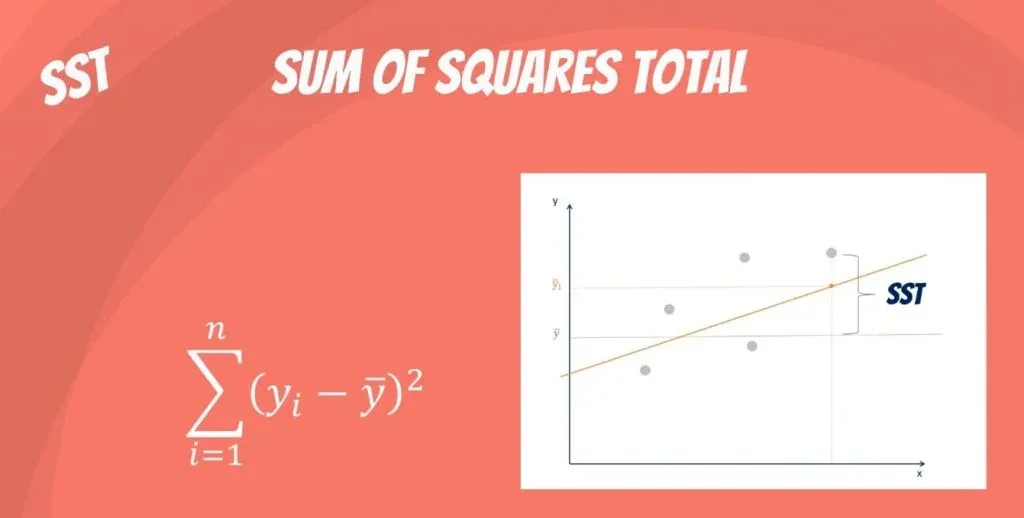
The sum of squares total (SST) or the total sum of squares (TSS) is the sum of squared differences between the observed dependent variables and the overall mean. Think of it as the dispersion of the observed variables around the mean—similar to the variance in descriptive statistics. But SST measures the total variability of a dataset, commonly used in regression analysis and ANOVA.
Mathematically, the difference between variance and SST is that we adjust for the degree of freedom by dividing by n–1 in the variance formula.
\[SST=\sum_{i=1}^{n}{(y_i-\bar{y})}^2\]
Where:
\( {{y}}_i\ \) – observed dependent variable
\(\bar{y}\ \) – mean of the dependent variable
What Is SSR in Statistics?
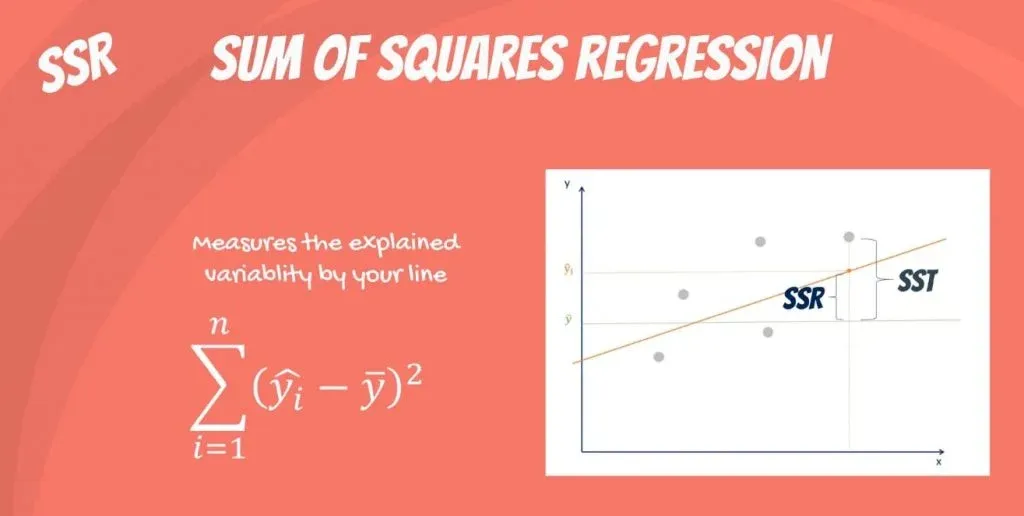
The sum of squares due to regression (SSR) or explained sum of squares (ESS) is the sum of the differences between the predicted value and the mean of the dependent variable. In other words, it describes how well our line fits the data.
The SSR formula is the following:
\[SSR=\sum_{i=1}^{n}{({\hat{y}}_i-\bar{y})}^2\]
Where:
\( {\hat{y}}_i\ \) – the predicted value of the dependent variable
\(\bar{y}\ \) – mean of the dependent variable
If SSR equals SST, our regression model perfectly captures all the observed variability, but that’s rarely the case.
Alternatively, you can use a Sum of Squares Calculator to simplify the process.
What Is SSE in Statistics?
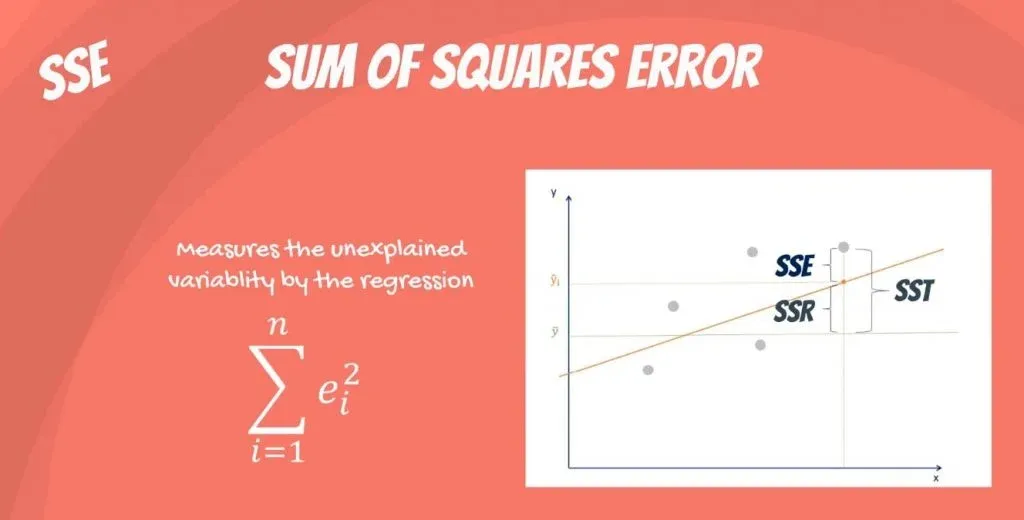
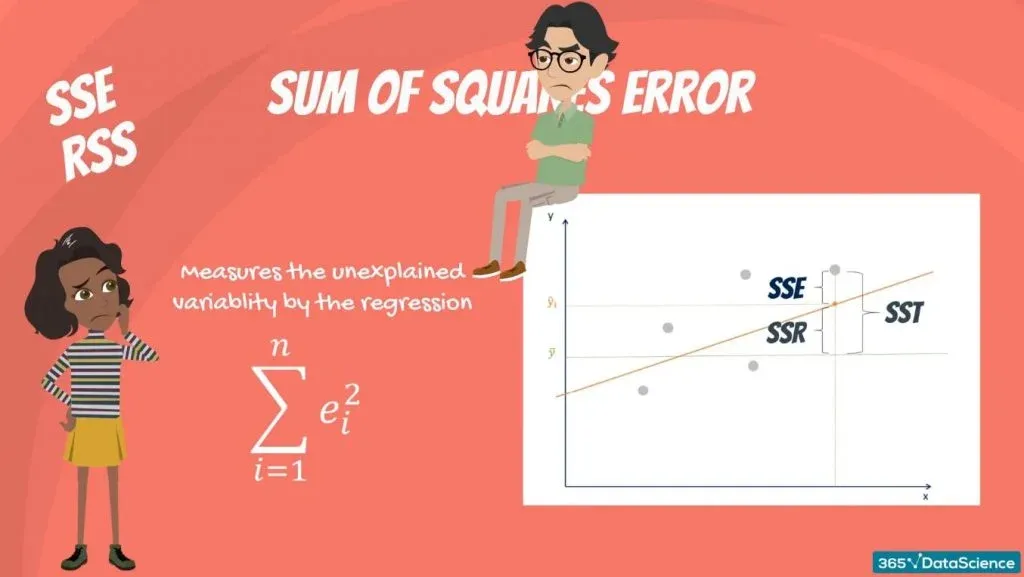
The sum of squares error (SSE) or residual sum of squares (RSS, where residual means remaining or unexplained) is the difference between the observed and predicted values.
The SSE calculation uses the following formula:
\[SSE=\sum_{i=1}^{n}\varepsilon_i^2\]
Where \(\varepsilon_i\) is the difference between the actual value of the dependent variable and the predicted value:
\( \varepsilon_i=\ y_i-{\hat{y}}_i \)
Regression analysis aims to minimize the SSE—the smaller the error, the better the regression’s estimation power.
The Confusion between the Abbreviations
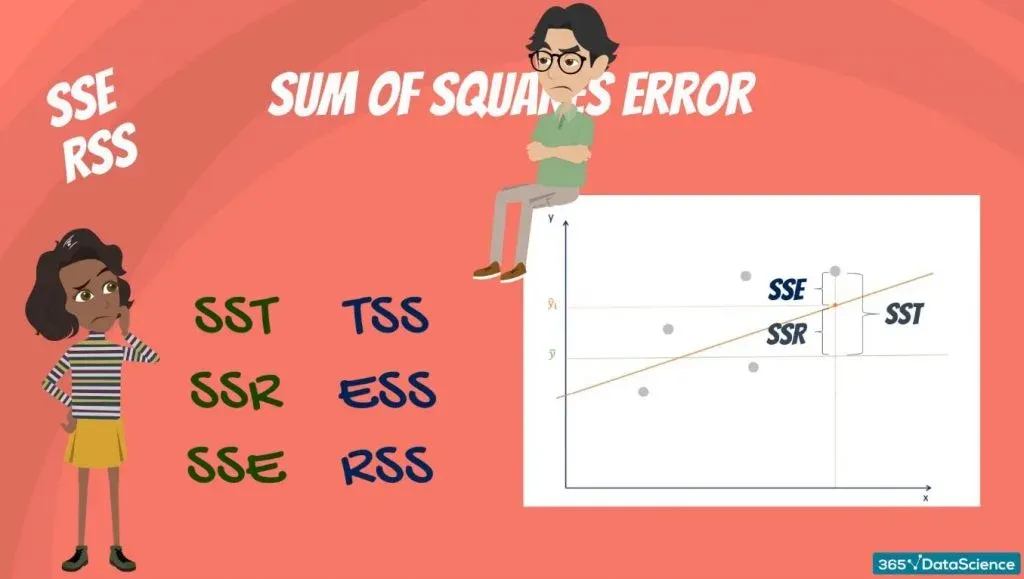
As mentioned, the sum of squares error (SSE) is also known as the residual sum of squares (RSS), but some individuals denote it as SSR, which is also the abbreviation for the sum of squares due to regression.
Although there’s no universal standard for abbreviations of these terms, you can readily discern the distinctions by carefully observing and comprehending them.
The conflict regards the abbreviations, not the concepts or their application. So, remember the definitions and the possible notations (SST, SSR, SSE or TSS, ESS, RSS) and how they relate.
What Is the Relationship between SSR, SSE, and SST?
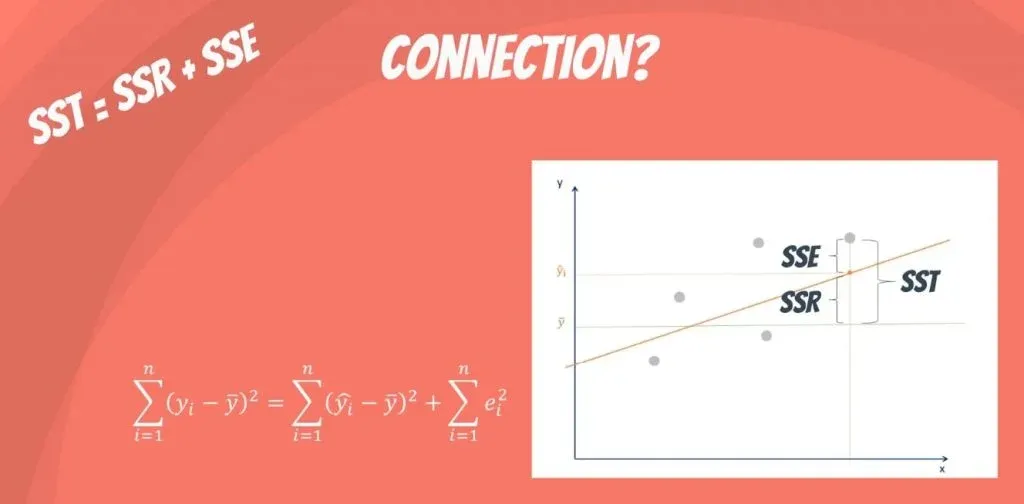
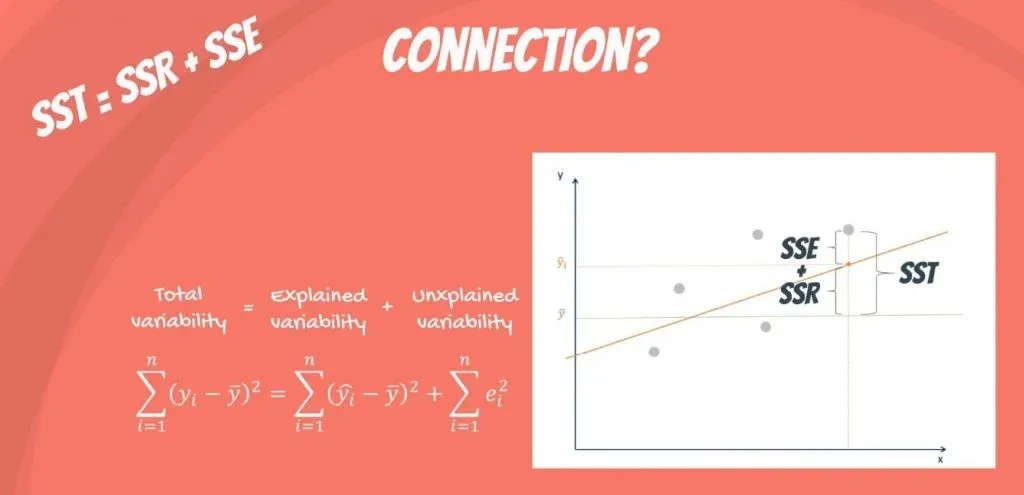
Mathematically, SST = SSR + SSE.
The rationale is the following:
The total variability of the dataset is equal to the variability explained by the regression line plus the unexplained variability, known as error.
Given a constant total variability, a lower error means a better regression model. Conversely, a higher error means a less robust regression. And that’s valid regardless of the notation you use.
Next Steps
Why do we need SST, SSR, and SSE? We can use them to calculate the R-squared, conduct F-tests in regression analysis, and combine them with other goodness-of-fit measures to evaluate regression models.
Our linear regression calculator automatically generates the SSE, SST, SSR, and other relevant statistical measures. The adjacent article includes detailed explanations of all crucial concepts related to regression, such as coefficient of determination, standard error of the regression, correlation coefficient, etc.
Enhance your statistical knowledge by enrolling in our Statistics course. Join 365 Data Science and experience our program for free.

