Following a hiring spree in the tech sector during the pandemic, employers have resorted to mass layoffs due to concerns about the upcoming economic recession. Over 150,000 people have been affected by the 2022 tech layoffs, and the wave continues in 2023, with over 68,500 new job cuts in January alone.
Media coverage is extensive but primarily focused on the firms behind the layoffs and the consequences for employees.
Instead of adding to a growing body of research, we decided to tap into unexplored territory and examine the characteristics of those laid off. So, we analyzed the public LinkedIn profiles of 1,157 workers laid off from tech companies.
The insights from our study help us understand who was affected and provide a distinct view of the reasons behind the layoffs and their impact on the job market.
Read on for our complete list of tech layoff statistics about the affected employees. Discover how many found a new job and who’s still searching in 2023.
Who Was Affected by the 2022–2023 Tech Layoffs: Table of Contents
- Crucial Tech Layoff Statistics
- Methodology
- Who Was Affected by the Layoffs?
- The Typical Laid-Off Individual in 2022–2023
- The Aftermath: Who Is on the Job Market?
Crucial Tech Layoff Statistics
Tech companies—especially the giants—were on a hiring spree during the pandemic as the world moved online. But this over-hiring isn’t sustainable in the current economic situation. In preparation for the recession, many resort to mass layoffs.
Is this an attempt to cut down the employee count to pre-pandemic levels? Let’s look at the numbers:
|
Company |
Number of Employees 2021 |
New Employees 2020–2021 |
Employee Growth 2019–2021 |
Number of Layoffs 2022 |
% Laid Off 2022 |
|
|
7,500 |
2,600 |
53% |
4,400 |
58% |
|
Amazon |
1,608,000 |
800,000 |
99% |
18,000 |
1.1% |
|
Meta |
71,970 |
27,000 |
60% |
11,000 |
15% |
|
Microsoft |
181,000 |
58,000 |
47% |
10,000 |
5.5% |
|
Alphabet |
156,500 |
52,000 |
50% |
12,000 |
7.7% |
|
Apple |
154,000 |
17,000 |
12% |
— |
— |
Note: The data is available from Macrotrends and Statista.
As of January 2023, Apple hasn’t made or announced any mass layoffs. Some attribute this to the fact that it increased its workforce by only 12% during the pandemic. But only the future can tell if it manages to resist the wave of job cuts in 2023.
Twitter triggered the loudest reaction, not because of the number of layoffs, but because it cut down the looming 58% of its workforce—more than it hired during the pandemic. Other big tech companies’ layoffs are in the thousands, which is only a fraction of their total employee counts and of the number of workers hired during the pandemic.
Unfortunately, the job cuts will continue in 2023. According to Layoffs.fyi, over 68,500 employees were laid off in January, exceeding the November peak of 52,370. And if the aim is to approximate pre-pandemic levels, many more are to come.
This is the story told by bulk numbers and percentages. But who’s behind those numbers? Can we find other explanations if we look closer at those laid off?
Methodology
We analyzed 1,157 LinkedIn profiles of people laid off in the period November 2022 – January 2023. Company quotas were assigned to limit bias, and convenience sampling was employed due to data accessibility limitations.
Our findings are biased toward professionals who are active on LinkedIn and rely on the assumption that the profiles on this platform are an accurate representation of individuals’ professional biographies. Still, the findings from the study can be accepted with a reasonable degree of scientific certainty.
Who Was Affected by the Layoffs?
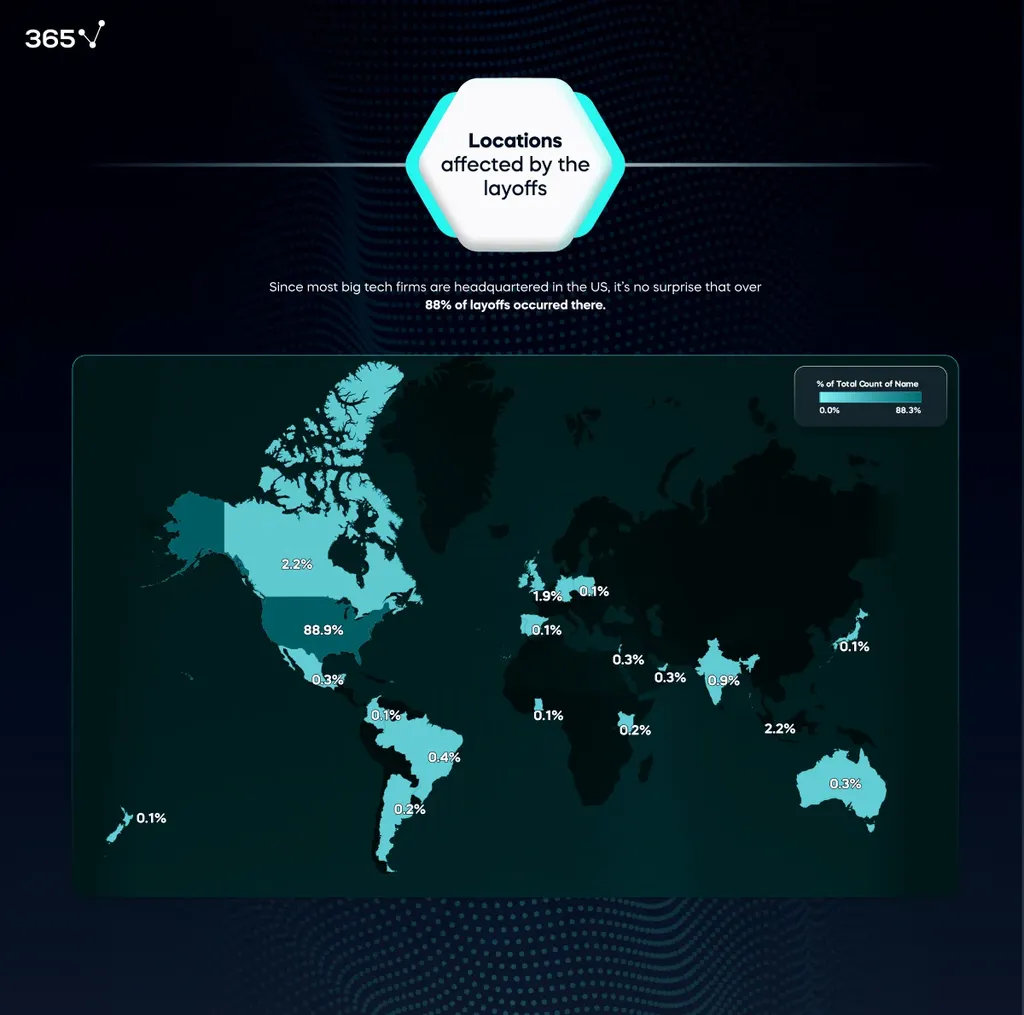
The job cuts in big tech companies attracted the attention of the public the most, which is why we decided to examine them in more detail, starting with the location.
Since most big tech firms are headquartered in the US, it's no surprise that nearly 90% of the layoffs in our sample occurred there.

Which were the most-affected positions?
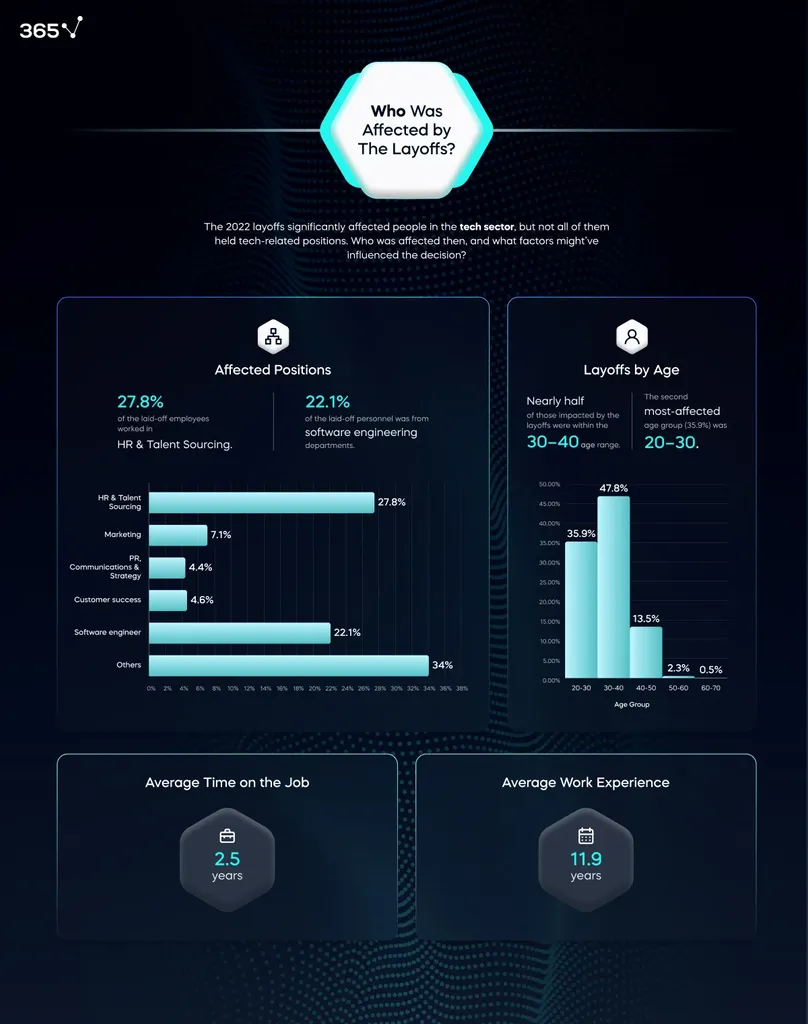
Interestingly, our sample's largest group of laid-off employees did not hold tech jobs—27.8% worked in HR & Talent Sourcing, while software engineers came in second with 22.1%. Marketing employees followed them with 7.1%, customer service with 4.6%, PR, communications & strategy with 4.4%, etc.
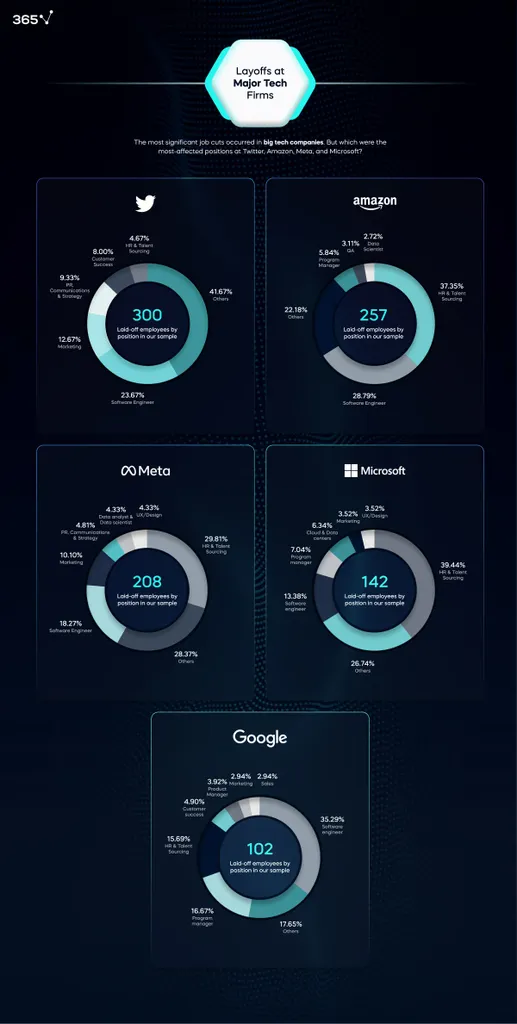
The distribution of layoffs by position at Twitter, Amazon, Meta, Microsoft, and Google is very similar. But while HR departments took the biggest hit at Amazon, Meta, and Microsoft, the software engineer was the most-affected position at Twitter and Google.

The 300 laid-off employees from Twitter in our sample are from the following departments:
- Software engineer: 23.7%
- Marketing: 12.7%
- PR, Communications & Strategy: 9.3%
- Customer success: 8%
- HR & Talent Sourcing: 4.7%
- Others: 41.7%
Amazon
Our sample contains 257 laid-off workers from Amazon, distributed among the following positions:
- HR & Talent Sourcing: 37.4%
- Software engineer: 28.8%
- Program manager: 5.8%
- QA: 3.1%
- Data scientist: 2.7%
- Others: 22.2%
Meta
The 208 laid-off employees in our sample from Meta are from the following departments:
- HR & Talent Sourcing: 29.8%
- Software engineer: 18.3%
- Marketing: 10.1%
- PR, Communications & Strategy: 4.8%
- Data analyst & Data scientist: 4.3%
- UX/Design: 4.3%
- Others: 28.4%
Microsoft
Our sample contains 142 laid-off workers from Microsoft, distributed among the following positions:
- HR & Talen Sourcing: 39.4%
- Software engineer: 13.4%
- Program manager: 7%
- Cloud & Data centers: 6.3%
- Marketing: 3.5%
- UX/Design: 3.5%
- Others: 26.7%
The 102 laid-off employees from Google in our sample are from the following departments:
- Software engineer: 35.3%
- Program manager: 16.7%
- HR & Talent Sourcing: 15.7%
- Customer success: 4.9%
- Product manager: 3.9%
- Marketing: 2.9%
- Sales: 2.9%
- Others: 17.7%

Although somewhat unexpected, these findings make sense. With hiring freezes and mass layoffs in place, recruitment teams become obsolete. This could also indicate that jobs like recruitment are beginning to be automated.
The layoffs may be partially a consequence of the companies’ plans to invest in AI and automation. Microsoft and Google have already announced their plans to invest in AI-powered solutions like ChatGPT.
Could this be another reason behind the mass layoffs? Are there other factors that could explain these actions?
Let’s review in more detail the characteristics of those laid off.
The Typical Laid-Off Individual in 2022–2023

Note again that our findings are biased toward professionals who are active on LinkedIn, so all statistics reflect the tendencies and characteristics of this sample.
Age
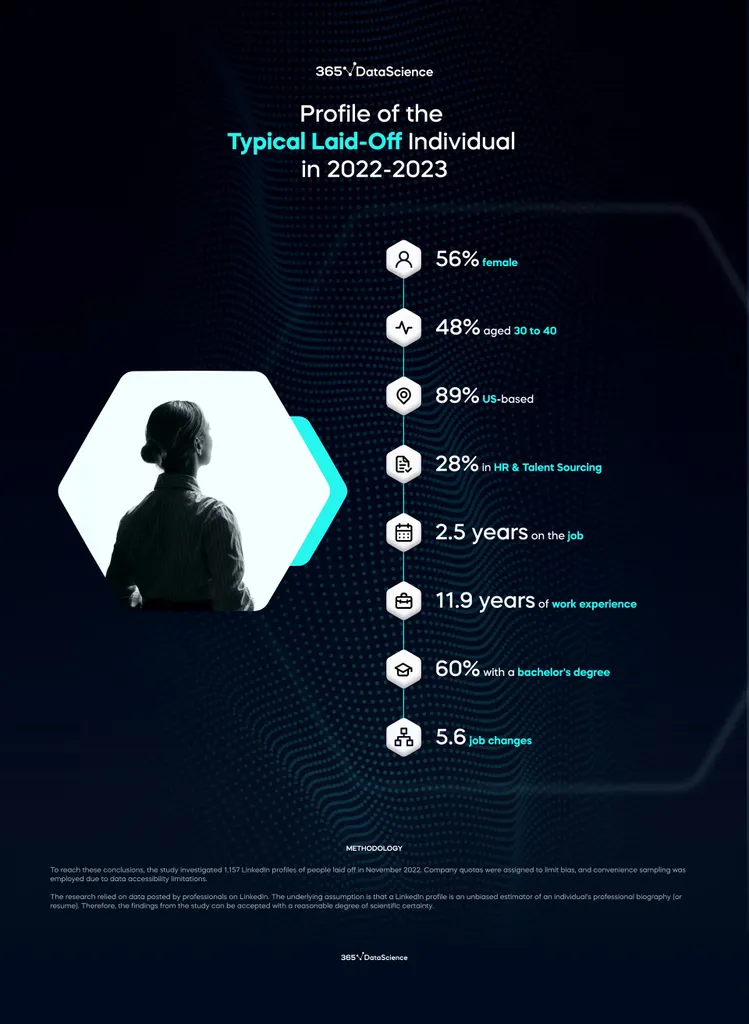
According to our research, nearly half of those impacted by the layoffs (47.8%) were within the 30–40 age range. The second most-affected age group (35.9%) was 20–30.
Gender
We also gathered data about the gender of laid-off employees and found that women were disproportionately affected. Although two-thirds of the tech workforce consists of men, more than half of those laid off are women—56% female, 43.8% male, and 0.2% preferred the pronouns they/them.
So even though women make up a smaller portion of the tech workforce, they are predominant among those laid off—further aggravating the gender gap in the sector.
Time on the Job
Our findings support the speculation that the layoffs at least partly result from the over-hiring during the pandemic. The average time on the job before the layoffs was 2.5 years, which means they were hired during the Covid-19 lockdowns.
Work Experience
Further, the average work experience of those laid off was 11.9 years, meaning that seniority level wasn’t among the primary selection criteria. More viable explanations include the higher salaries for more senior roles, the overstaffing during the pandemic, and possibly the challenge of onboarding the large number of employees hired during the work-from-home era.
Job Changes
The average number of job changes for those in our sample was 5.6. The average person changes jobs around 12 times in their lifetime—4.5 of which happen between the ages of 25 and 35.
Since most laid-off employees in our sample were 20 to 30 or 30 to 40 years old, 5.6 job changes are expected. So, there isn’t any evidence of employee incompetence or lack of loyalty as an underlying reason for the layoffs.
Education
The level of education reported by the people in our sample is another confirmation that experience and qualifications weren’t key criteria for selecting laid-off employees.
In fact, over 59% held a bachelor's degree, 30% held a master’s degree, 4% had a Ph.D., and 1% had an MBA. Another 5% hadn’t added their higher education to LinkedIn.
The most common areas of specialization included the following:
- Computer Science/IT: 22%
- Business Administration: 13%
- Communications: 6%
- Marketing: 5%
- Psychology: 4%
- Management: 4%
- Engineering: 3%
- Human Resource Management: 3%
- Other: 25%
The Aftermath: Who Is on the Job Market?
A worrying statistic in our tech layoff research is that just over 10% of the workers in our sample have found a new job as of January 2023.
The rest are still on the job market, competing for the same positions during hiring freezes and continuing layoffs. Our results show that these are qualified individuals with solid education and experience. Will they remain for long on the market? Or switch careers?
It’s too early to tell how events will unfold. (Check ot our more recent research on the aftermath of the tech layoffs for an insight.)
But the tech layoff statistics presented above provide valuable insights into who was affected by the mass job cuts and why.
The job market is constantly evolving, with some positions becoming obsolete due to advancements in technology and automation. But new opportunities emerge. To thrive in today's competitive job market, it's essential to possess the ability to adapt and stay up to date with the latest technological innovations.
Start by mastering ChatGPT with our Intro to ChatGPT and Generative AI course.
Finally, our research reveals that we still have a long way to go regarding equality and fairness in the tech sector. Unfortunately, the current layoffs are a considerable step back.


