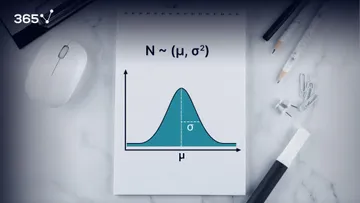
When we use the term normal distribution in statistics, we usually mean a probability distribution. Good examples are the Normal distribution, the Binomial distribution, and the Uniform distribution.
Alright. Let’s start with a definition!
A distribution in statistics is a function that shows the possible values for a variable and how often they occur.
Think about a die. It has six sides, numbered from 1 to 6. We roll the die. What is the probability of getting 1?
It is one out of six, so one-sixth, right? What is the probability of getting 2? Once again - one-sixth. The same holds for 3, 4, 5 and 6.
Now. What is the probability of getting a 7? It is impossible to get a 7 when rolling a die.
Therefore, the probability is 0.
The distribution of an event consists not only of the input values that can be observed, but is made up of all possible values.
So, the distribution of the event - rolling a die - will be given by the following table. The probability of getting one is 0.17, the probability of getting 2 is 0.17, and so on... you are sure that you have exhausted all possible values when the sum of probabilities is equal to 1% or 100%. For all other values, the probability of occurrence is 0.
Each probability distribution is associated with a graph describing the likelihood of occurrence of every event. Here’s the graph for our example. This type of distribution is called a uniform distribution.
It is crucial to understand that the distribution in statistics is defined by the underlying probabilities and not the graph. The graph is just a visual representation. You can learn more about visualizing data in statistics from our articles Visualizing Data with Contingency tables and Scatter Plots and Visualizing Data with Bar, Pie and Pareto Charts.
Alright. Now think about rolling two dice. What are the possibilities? One and one, two and one, one and two, and so on. Here’s a table with all the possible combinations. We are interested in the sum of the two dice. So, what’s the probability of getting a sum of 1? It’s 0, as this event is impossible. What’s the probability of getting a sum of 2? There is only one combination that would give us a sum of 2 – when both dice are equal to 1. So, 1 out of 36 total outcomes, or 0.03. Similarly, the probability of getting a sum of 3 is given by the number of combinations that give a sum of three divided by 36. Therefore, 2 divided by 36, or 0.06. We continue this way until we have the full probability distribution.
Let’s see the graph associated with it.
So, looking at it we understand that when rolling two dice, the probability of getting a 7 is the highest. We can also compare different outcomes such as: the probability of getting a 10 and the probability of getting a 5. It’s evident that it’s less likely that we’ll get a 10.
P.S. If you're considering a career in data science, feel free to read our career advice articles and check out the all-in-one 365 Data Science Training.
Watch our Next Video: Mean, Median and Mode.
Take our Statistics and Probability courses.
Check out our tutorials Measuring Asymmetry with Skewness,
Exploring the OLS Assumptions, and Explaining Standardization Srep-By-Step.