A great term in the field of statistics, which you can add to your dictionary, is skewness. It is the most commonly used tool to measure asymmetry. However, in order to fully understand it, basic knowledge of the measures of central tendency is vital.
Now, let’s focus on skewness. What is shown below, is the formula to calculate it.

Most likely, you will use software that performs the calculation for you. So, if you're looking for a shortcut to speed up your work, you can rely on our Skewness Calculator.
In this tutorial, however, we will not get into the computation, but rather the meaning of skewness.

What's the Meaning of Skewness?
So, skewness indicates whether the observations in a data set are concentrated on one side. Skewness can be confusing at the beginning, so an example will be useful.
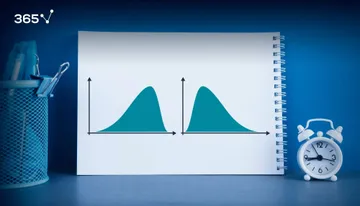
In the picture below, we have three data sets and their respective frequency distributions. We have also calculated the means, medians and modes.

Positive Skew
The first data set has a mean of 2.79 and a median of 2. Hence, the mean is bigger than the median. We say that this is a positive or right skew. From the graph below, you can clearly see that the data points are concentrated on the left side.

Important: The direction of the skew is counterintuitive. It does not depend on which side the line is leaning to, but rather to which side its tail is leaning to. So, right skewness means that the outliers are to the right.

It is interesting to see the measures of central tendency incorporated in the graph. You can tell that we have right skewness when:
- the mean is bigger than the median
- the mode is the value with the highest visual representation.

Zero Skew
In the second graph, we have plotted a data set that has an equal mean, median and mode. The frequency of occurrence is completely symmetrical and we call this a zero or no skew.

Most often, you will hear people say that the distribution is symmetrical.
Negative Skew
For the third data set, we have a mean of 4.9, a median of 5 and a mode of 6. As the mean is lower than the median, we say that there is a negative or left skew.

Once again, the highest point is defined by the mode. And as you might guess, it is called a left skew, because the outliers are to the left.
Why Skewness is Important
Skewness tells us a lot about where the data is situated.

In fact, the mean, median and mode should be used together to get a good understanding of the dataset. Measures of asymmetry like skewness are the link between central tendency measures and probability theory. This ultimately allows us to get a more complete understanding of the data we are working with.
Well, this is how we measure asymmetry. However, is there a way to measure something else? Like variability? Find out in our next tutorial.
***
Interested in learning more? You can take your skills from good to great with our statistics course!
Try statistics course for free
Next Tutorial: Measures of Variability: Variance, Standard Deviation and Coefficient of Variation