The normal distribution is essential when it comes to statistics. Not only does it approximate a wide variety of variables, but decisions based on its insights have a great track record.
If this is your first time hearing the term ‘distribution’, don’t worry. We have an article where we explain that the distribution of a dataset shows us the frequency at which possible values occur within an interval. There, we also mention several other fundamental distributions.
We've also made a video on the topic of normal distribution - you can watch it below or scroll down if you prefer reading.
Experienced statisticians can immediately distinguish a Binomial from a Poisson distribution.

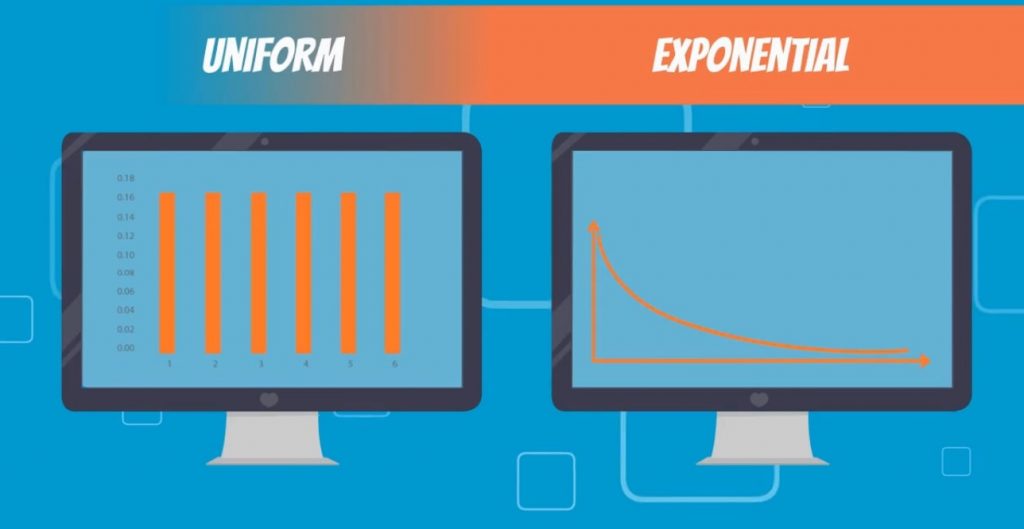
They can also tell if a certain distribution is either Uniform or Exponential with a quick glimpse at a plot.
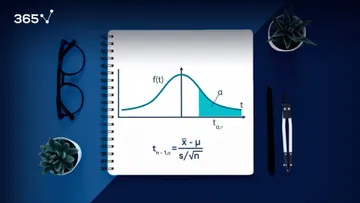
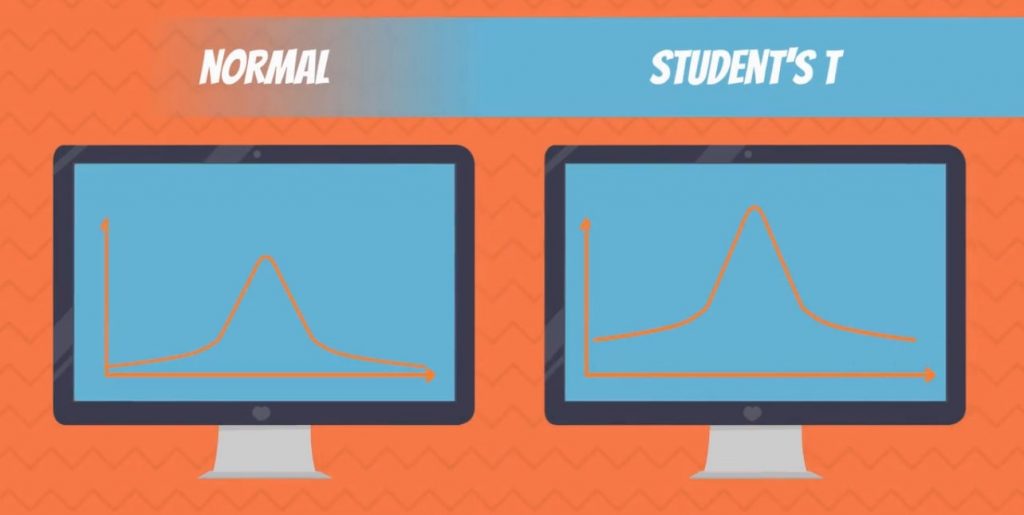
Normal Distribution vs. Student's T Distribution
In our tutorials, we will focus on the normal and student’s T distributions.
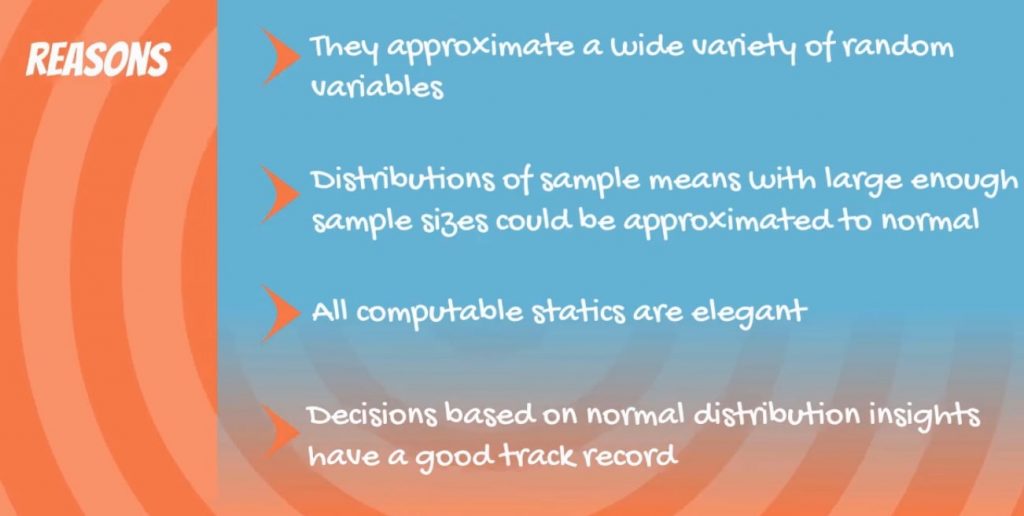
These are the reasons why:
- They approximate a wide variety of random variables.
- Distributions of sample means with large enough sample sizes could be approximated to normal.
- All computable statistics are elegant.
- Decisions based on normal distribution insights have a good track record.
If it sounds like gibberish now, we promise that after a few paragraphs, you will understand it.
The Normal Distribution Curve
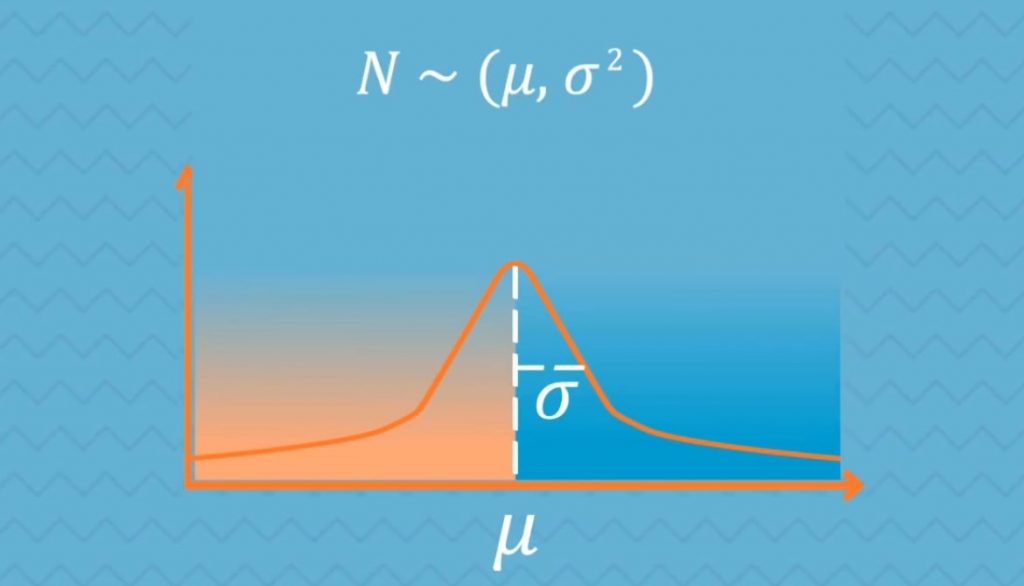
In the picture below, you can see a visual representation of a Normal distribution.
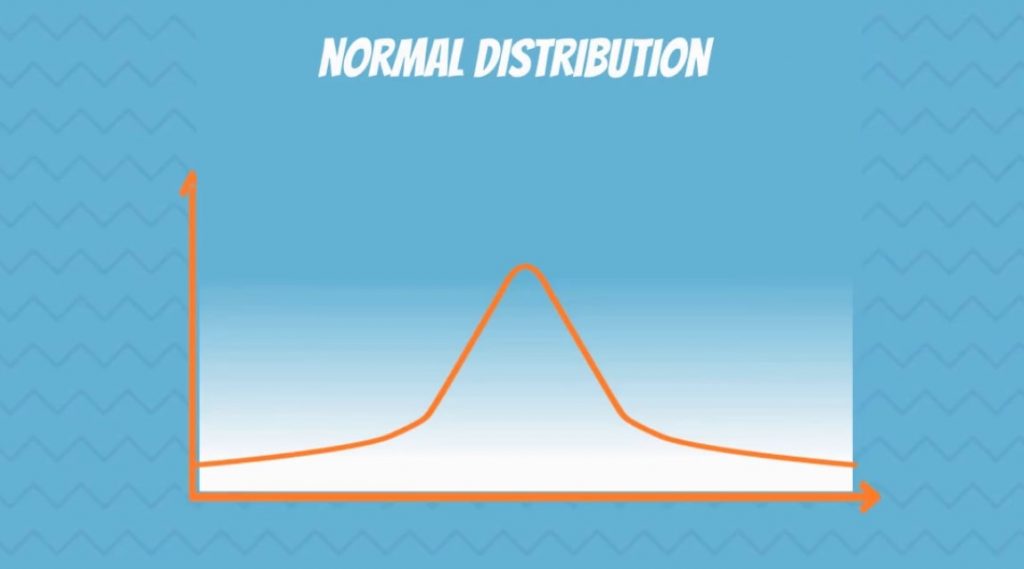
You have surely seen a normal distribution before because it is the most common one. The statistical term for it is Gaussian distribution. Though, many people call it the Bell Curve, as it is shaped like a bell.
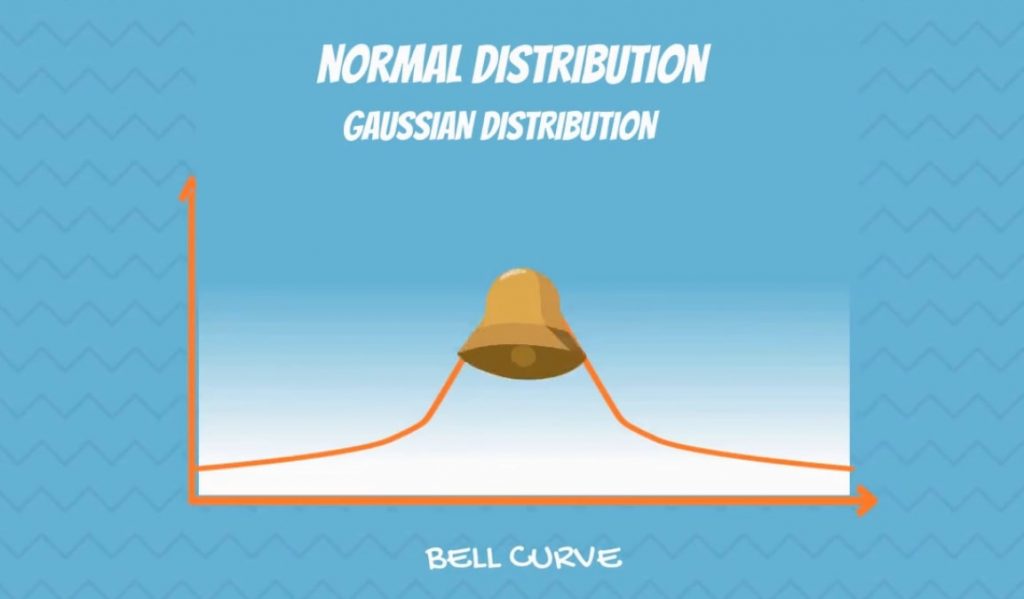
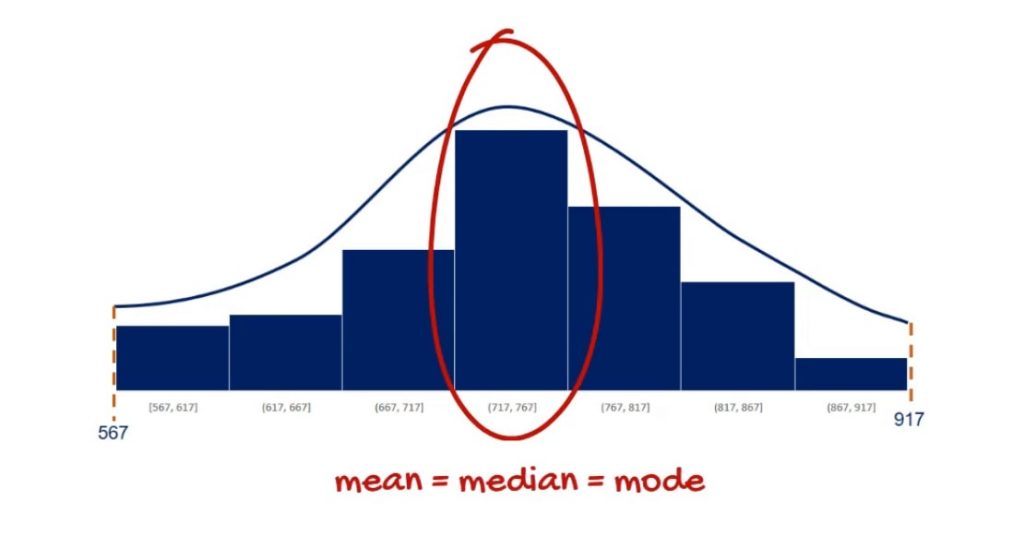
It is symmetrical and its mean, median and mode are equal.
If you know what skewness is, you will recognize that it has no skew! It is perfectly centred around its mean.
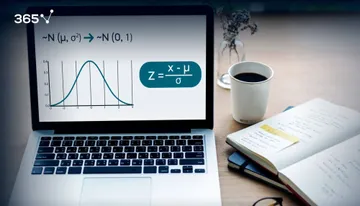
How it’s Denoted
N stands for normal and the tilde sign(~) shows it is a distribution. In brackets, we have the mean(μ) and the variance(σ2) of the distribution
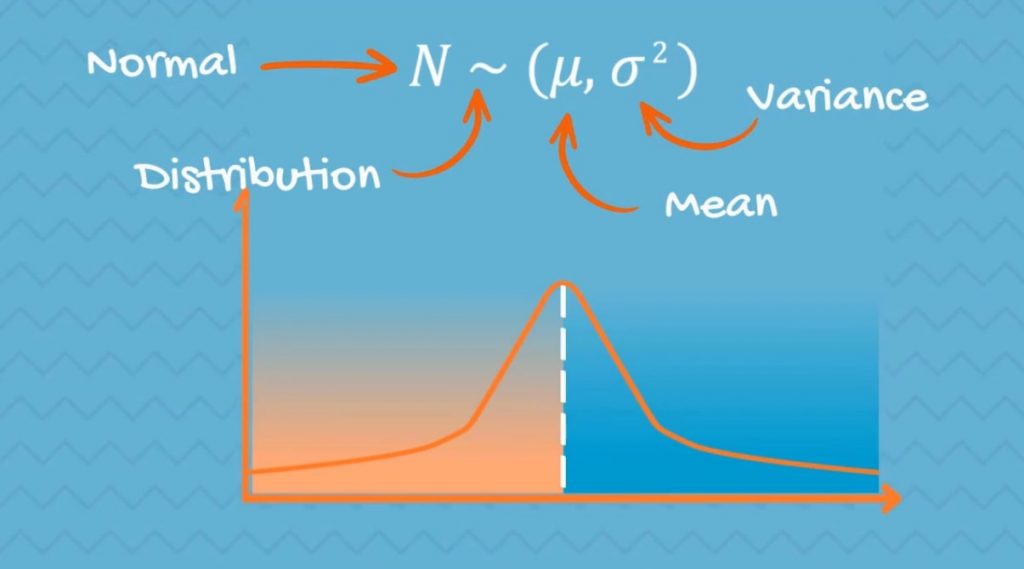
On the plane, you can notice that the highest point is located at the mean. This is because it coincides with the mode. The spread of the graph is determined by the standard deviation, as it is shown below.
Understanding Normal Distribution in Data Science
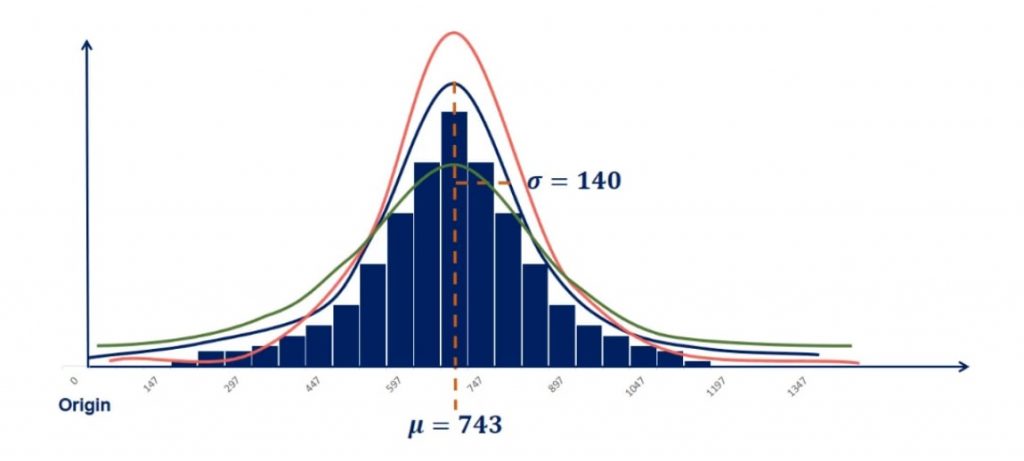
Below, you can see an approximately normally distributed histogram.
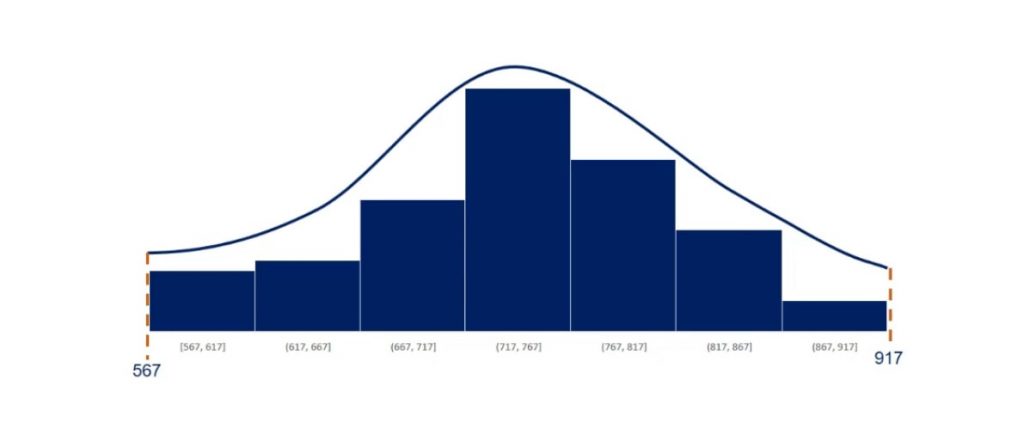
There is a concentration of the observations around the mean. This makes sense because it is equal to the mode.
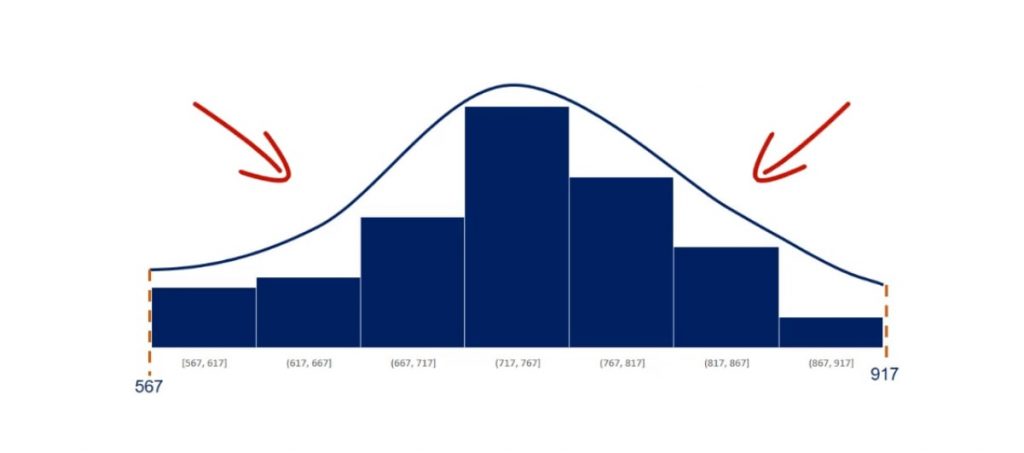
Moreover, it is symmetrical on both sides of the mean.
We used 80 observations to create this histogram. As shown below, its mean is 743 and its standard deviation is 140. 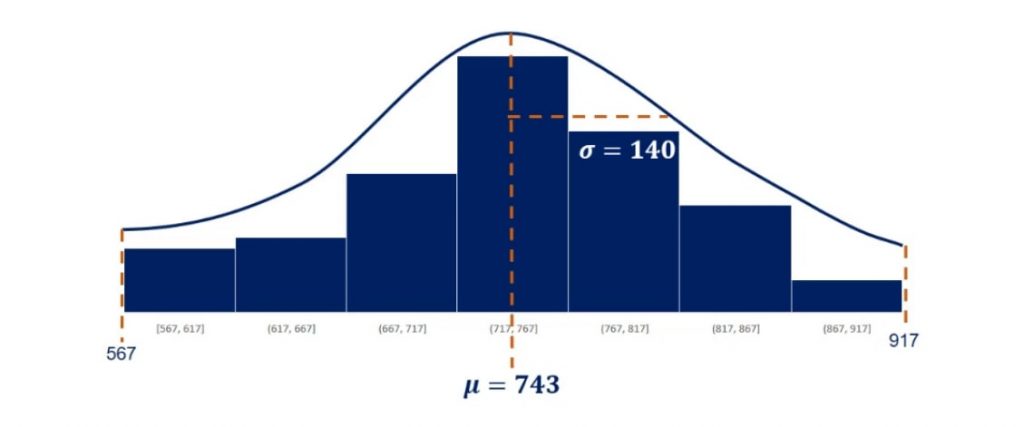
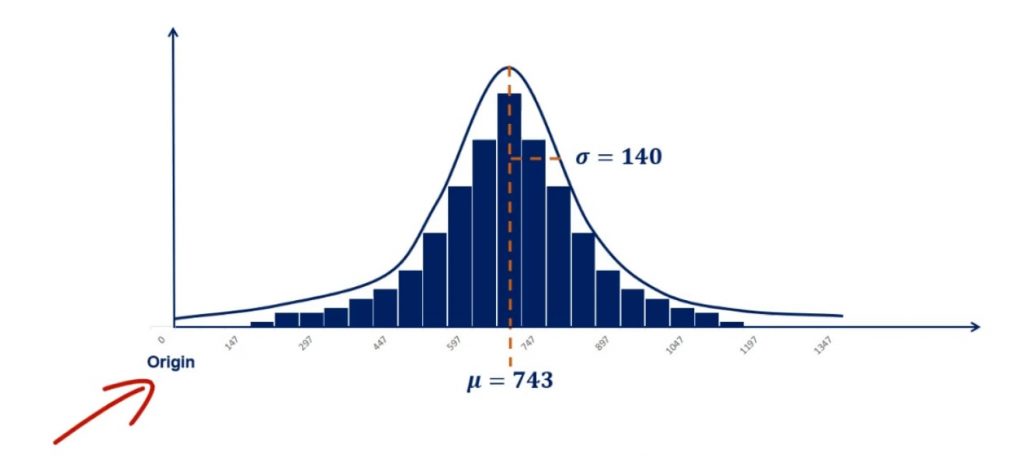
But what if the mean is smaller or bigger? Let’s first zoom out a bit by adding the origin of the graph. The origin is the zero point. As you can tell from the picture below, adding it to any graph gives perspective.
Controlling for the Standard Deviation in Normal Distribution
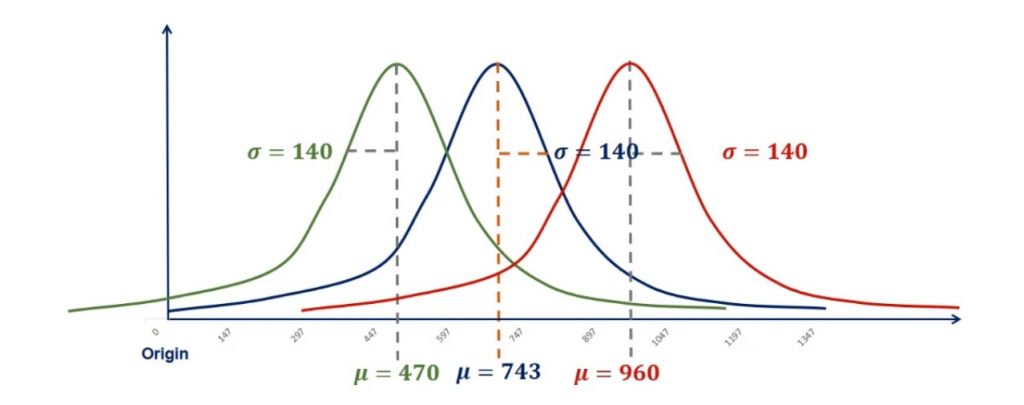
Keeping the standard deviation fixed, a lower mean would result in the same shape of the distribution, but on the left side of the plane. This is called controlling for the standard deviation.
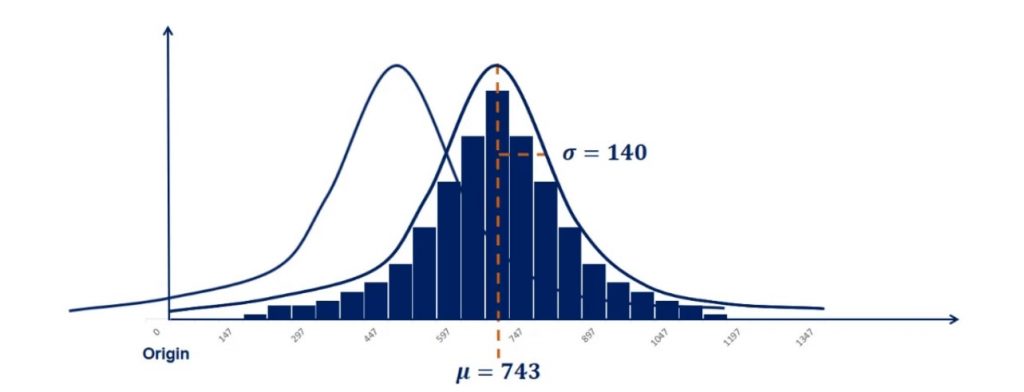
In the same way, a bigger mean would move the graph to the right, as shown in the picture below. 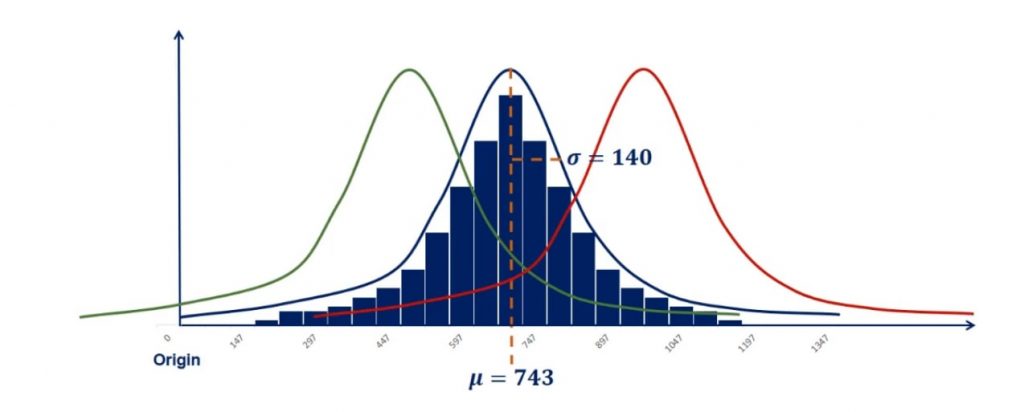
In our example, this resulted in two new distributions. One is with a mean of 470 and a standard deviation of 140. Whereas the other one is with a mean of 960 and a standard deviation of 140.
Controlling for the Mean in Normal Distribution
Now, let’s do the opposite.
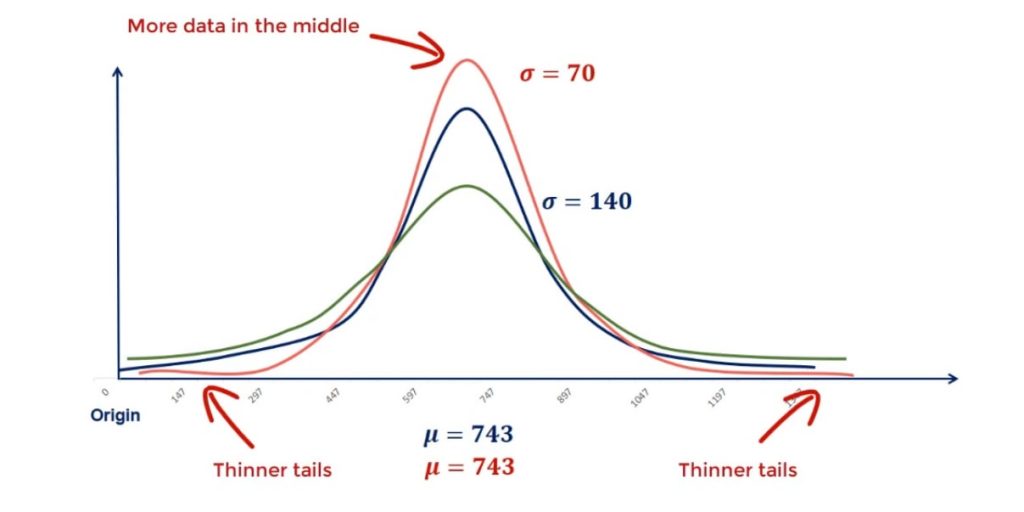
Controlling for the mean, we can change the standard deviation and see what happens. From the picture below, you can tell that this time the graph is not moving. But it is rather reshaping.
A lower standard deviation results in a lower dispersion, so more data in the middle and thinner tails.
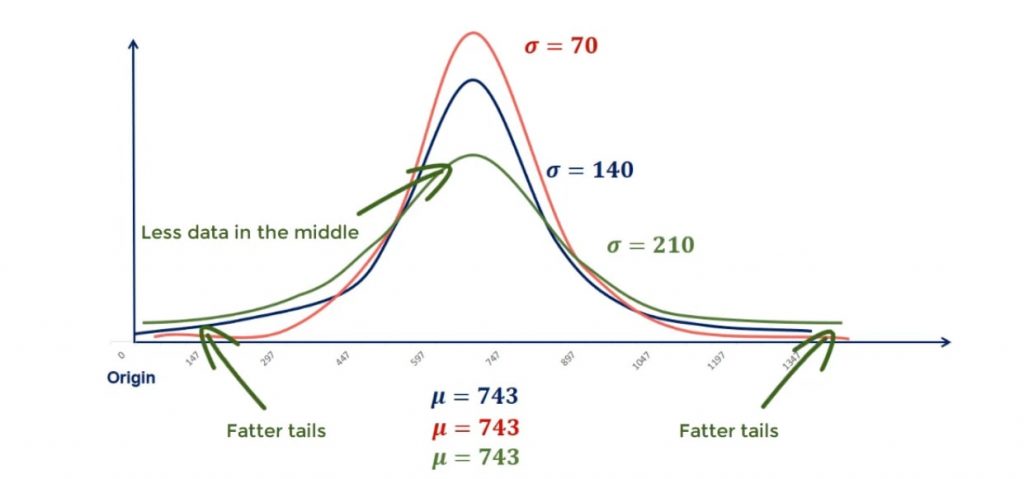
On the other hand, a higher standard deviation will cause the graph to flatten out with fewer points in the middle and more to the end. Or in statistics jargon – fatter tails.
Ways to Tackle Statistical Calculations
Most of the time, you'll need to calculate a number of measures in your analyses. You'll compare and contrast results to reach certain conclusions, which can be a lengthy and time-consuming process. If you're just starting out in the field of statistics, manual calculations can be a good practice to help you better understand how the various formulas work.
As time is of the essence, professionals often use software to handle complex calculations for them. So, if you're looking for a shortcut to speed up your work, you can rely on our Calculators. They will help you obtain the results you need in just a few clicks.
Want to Learn More About Probability Distribution and Statistics?
These are the basics of a normal distribution. You can recognize it by looking at its mean, median and mode. If they are equal and it has no skew, it is indeed normal. After reading this tutorial, you should be able to control for the standard deviation and for the mean as well. With this knowledge, you are ready to dive into the concept of standardization. In the linked article, you will find out how to create a standard normal distribution.
Interested in learning more? You can take your skills from good to great with our statistics course!