Resolved: Question about the yhat_yes and yhat_no equation
How do you get the yhat_yes and yhat_no e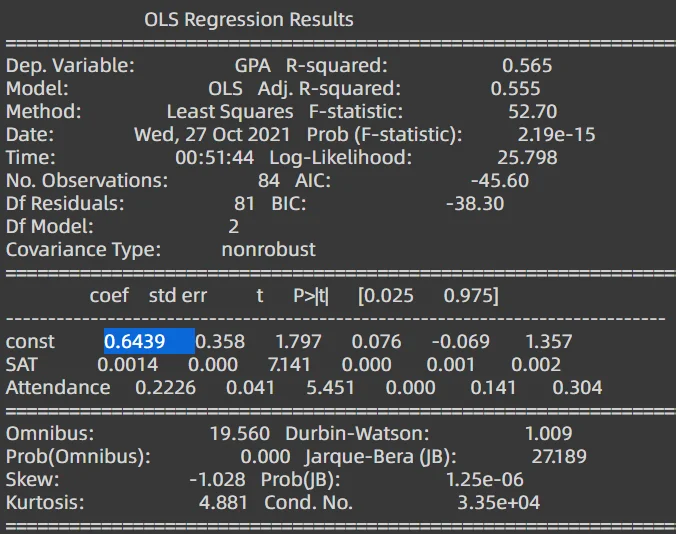 quation? Thank you so much! I could not find it in the summary table
Hey Jackie,
Thank you for the question!
Once we include the dummy variable into our regression model, the equation becomes:
GPA = 0.6439 + 0.0014 * SAT + 0.2226 * Dummy
What the coefficients' table can give you are the bias (called const in the table) as well as the coefficients in front of the SAT variable and the Dummy variable (called Attendance in the table). These values are 0.6439, 0.0014 and 0.2226, respectively. The table doesn't give you the values for yhat_no and yhat_yes. What we need to do to obtain them is the following.
The Dummy variable can take 2 different values:
1. For people who did not attend, Dummy = 0. Therefore, the equation above becomes simply:
GPA = 0.6439 + 0.0014 * SAT
This equation is defined as yhat_no in the code:
yhat_no = 0.6439 + 0.0014 * data['SAT']
2. For people who did attend classes, Dummy = 1. Therefore, the first equation becomes:
GPA = 0.6439 + 0.0014 * SAT + 0.2226 * Dummy = 0.6439 + 0.0014 * SAT + 0.2226 * 1 = 0.6439 + 0.2226 + 0.0014 * SAT = 0.8665 + 0.0014 * SAT
This equation is defined as yhat_yes in the code:
yhat_yes = 0.8665 + 0.0014 * data['SAT']
We now plot data['SAT'] on the x-axis. On the y-axis, we plot both yhat_no (the line that appears lower) and yhat_yes (the line that appears higher).
Hope this helps! Keep up the good work!
Kind regards,
365 Hristina