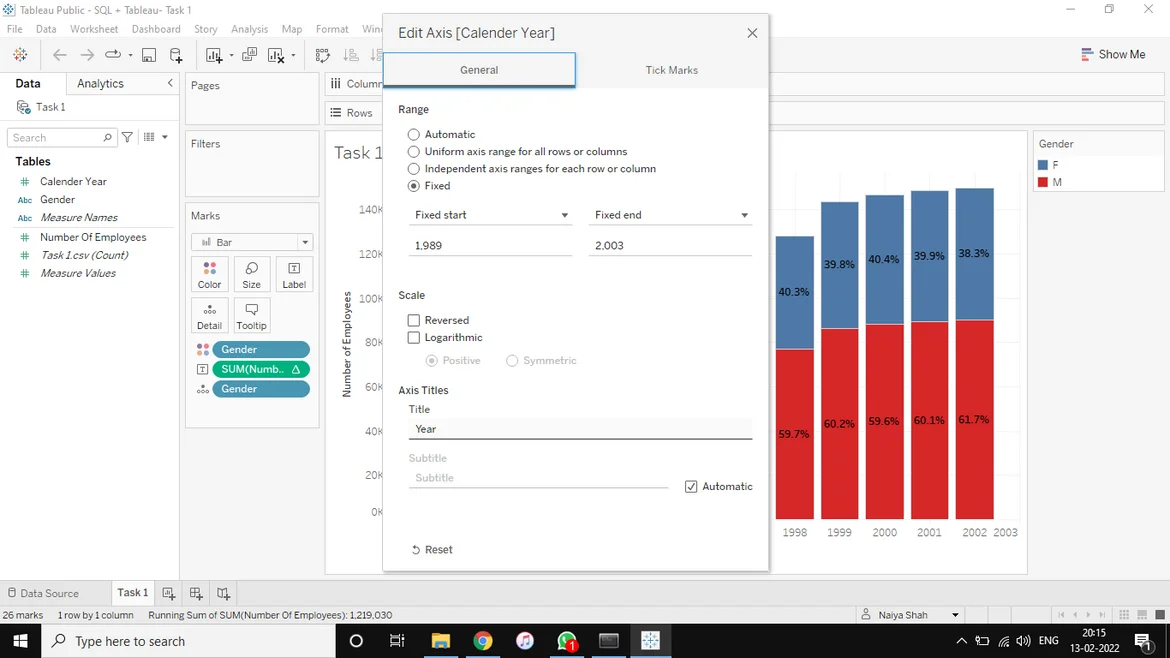
Resolved: The years 1989 and 2003 are displayed on the X axis after selecting the '1989 to 2003' range.
I changed the range for calendar year to 1989 to 2003 but on the graph both of the years are displayed as opposed to the solution here where the year starts from 1990 and ends at 2002. How do I fix that?
Hi Naiya!
Thanks for reaching out!
Can you please support your question with a screenshot showing which options you've chosen, as well as another one showing the output you've obtained? Only then will we be able to provide a specific answer. Thank you.
Looking forward to your reply.
Kind regards,
Martin
Hello
I am attaching the screenshot for the options I have chosen and the link to the chart, as uploading more than one image is not allowed.
The years 1989 and 2003 are displayed on the X-axis, whereas in the solution in the video, those years are not displayed.
Hope this clarifies my question.
Thank you.
Hi Naiya!
Thank you for replying to our question.
Indeed, I suppose the difference stems from a recent update in the Tableau software itself (In other words, please take into account that we've recorded the relevant video in an older version).
Nevertheless, please remember to focus on the output produced - the visualization is the central output you will obtain from using Tableau. Its versions will change, improvements will be made, but we must adapt to them and continue producing efficient and meaningful graphs.
Hope this helps.
Best,
Martin
Hello Martin
Thank you for answering. I thought it was something to do with the update, but wanted to confirm anyway to see if I wasn't doing anything wrong. I don't have any doubts now.
Thank you.
Hi Naiya!
Great! Thank you very much for your reply!
Good luck and please feel free to post another question should you encounter any difficulties. Thank you.
Best,
The 365 Team