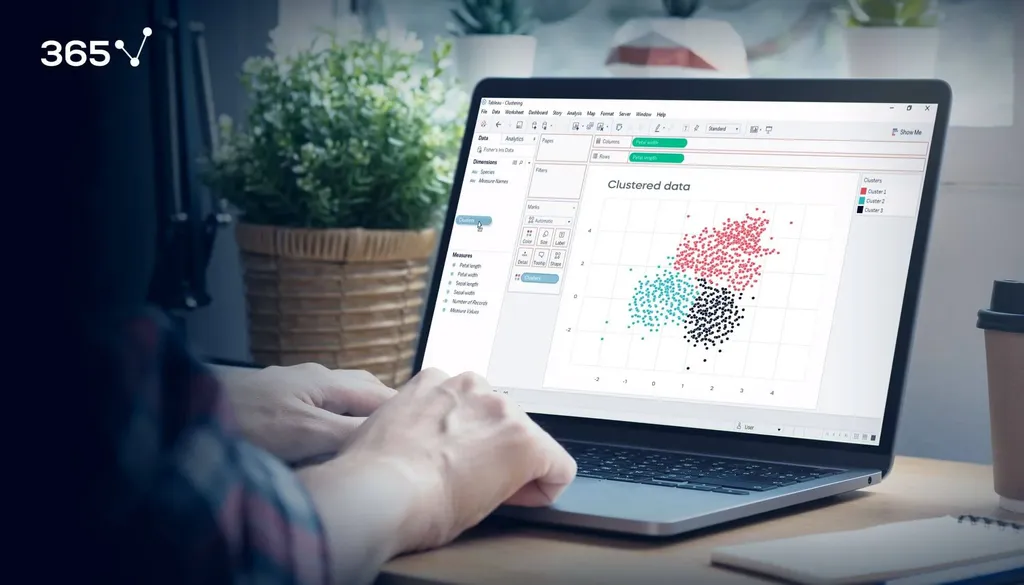
Cluster analysis is a type of unsupervised machine learning technique, often used as a preliminary step in all types of analysis. It is very useful for exploring and identifying patterns in datasets as not all data is tagged or classified. This is why most data scientists often turn to it when they have no idea where to start or what to expect.
In this article, we will explore this fundamentally different data science method and give you some cluster analysis examples to put things into perspective.
But first, let’s start with a definition.
What Is Cluster Analysis Exactly?
Technically speaking, cluster analysis is a multivariate statistical technique that groups observations based on some of their features or variables. That sounds a little complicated, doesn’t it?
Intuitively speaking, a simpler cluster analysis definition is that it identifies data based on shared properties and divides them into separate groups – otherwise known as clusters.
A Cluster Analysis Example
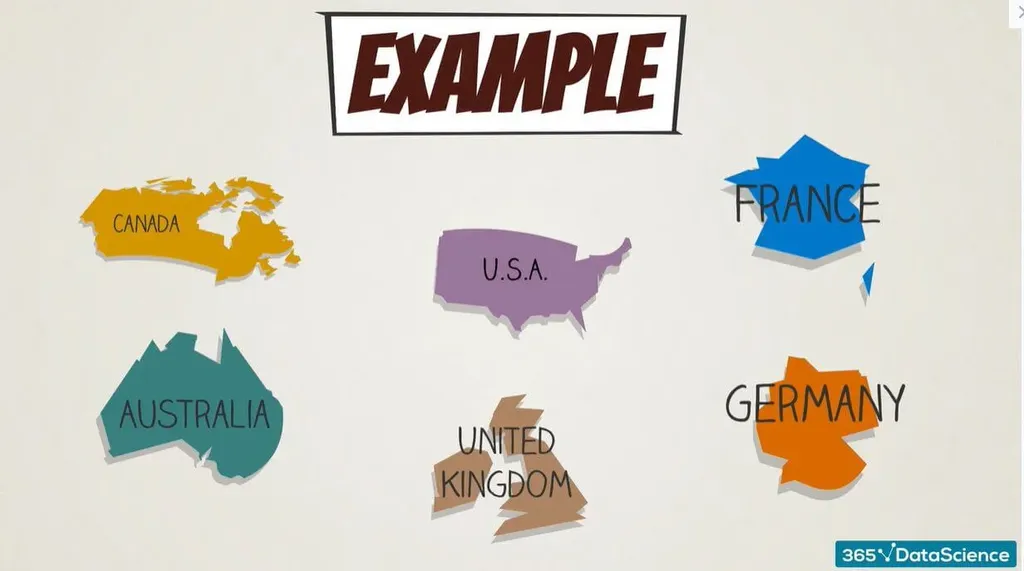
There are 6 countries (or observations) in a dataset:
- United States
- Germany
- Australia
- United Kingdom
- France
- Canada
By performing this mysterious technique called cluster analysis, we split the countries into three clusters:
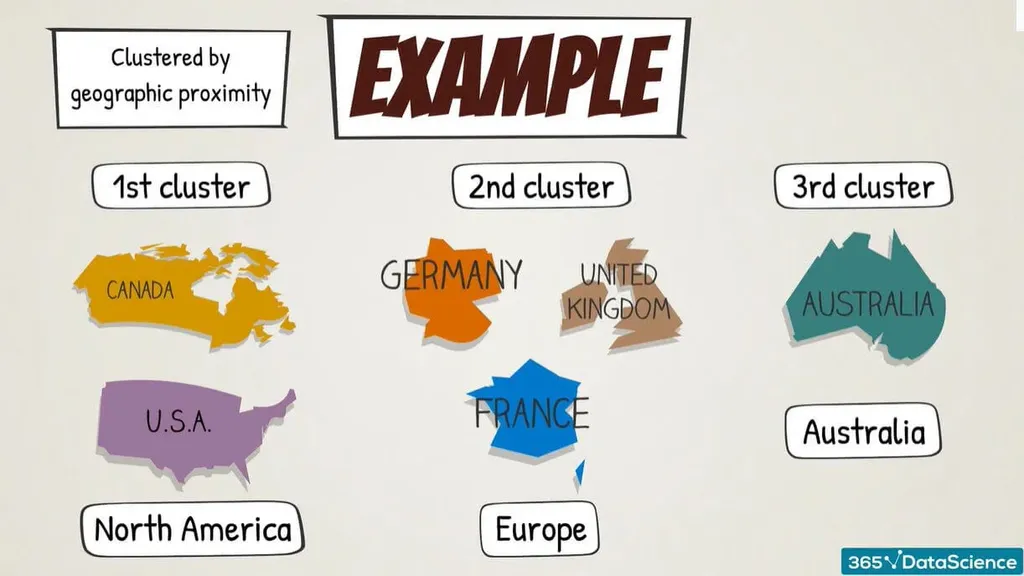
- USA and Canada
- Germany, UK, and France
- Australia
Even at first glance, we can draw the conclusion that these clusters represent the countries by their continental region – North America, Europe and Australia, respectively. The main feature of this specific cluster analysis is geographic proximity.
What if we take the same 6 countries, but this time group them into two clusters? We achieve the following results:
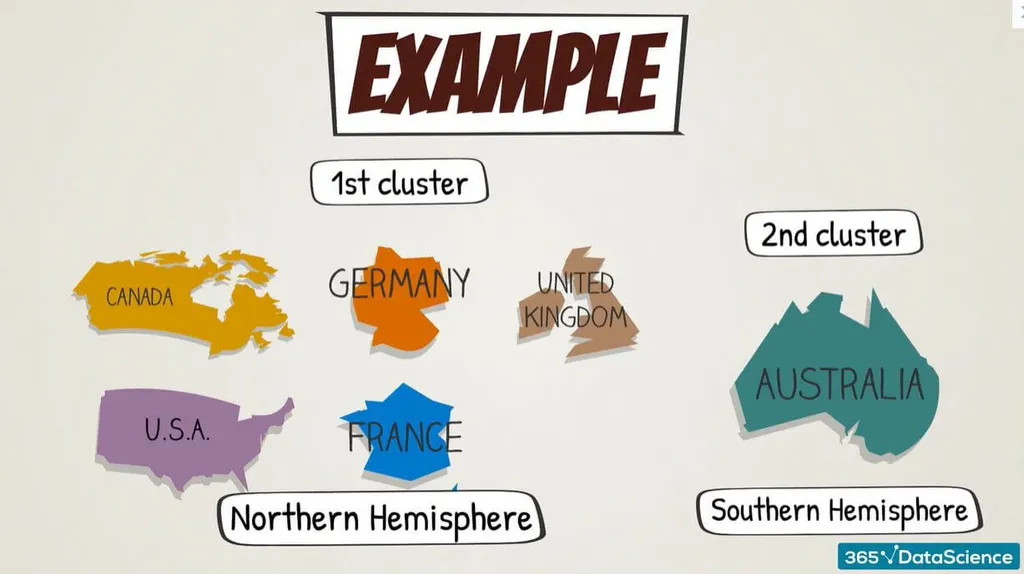
- USA, Canada, the UK, Germany, and France
- Australia
Upon some consideration, we can conclude that the first cluster shows countries in the Northern Hemisphere, while the second – a country in the Southern Hemisphere. Once again, the main feature of the cluster analysis is based on geographic proximity.
There’s other possible results we can obtain. Diving the observations into two clusters can also generate something like this:
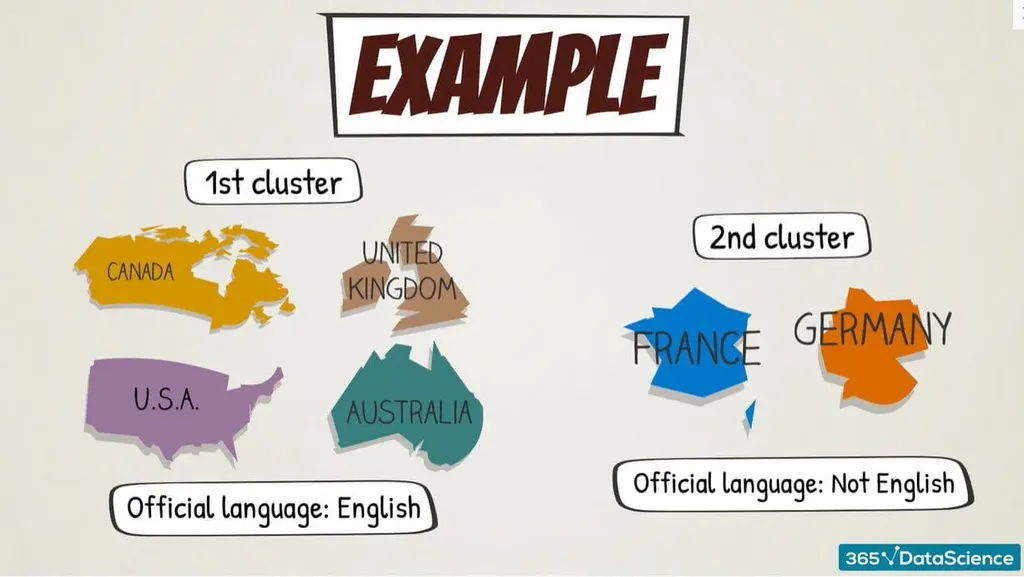
- USA, Canada, UK, and Australia
- Germany and France
The first cluster (USA, Canada, UK, and Australia) represents countries with English as the official language, whereas the second cluster (Germany and France) – countries with a different official language than English.
All three examples are perfectly logical, just in a different way. In the first two cases, the clusters differentiate the data by geographic proximity, while in the third case, the result is based on the language those countries speak in.
Of course, geographic proximity and language are just two of the many different cluster analysis features.
What Is the Final Goal of Cluster Analysis?
The goal of clustering is to maximize the similarity of the observations within a given cluster and maximize the dissimilarity between separate clusters. That, of course, is done with respect to one or several features.
What Are Some Cluster Analysis Applications?
There are many clustering applications. From data mining and machine learning to object segmentation and natural language processing, there’s countless ways to implement this technique into your work.
Cluster analysis is used in fields such as computational biology, medical diagnostics and business to detect patterns, provide insight, and contribute to valuable scientific, technological or financial improvements.
Market Segmentation
If you work in data science, that’s where you can most definitely apply your clustering skills.
Companies use cluster analysis in marketing to segment their customers into specific consumer clusters and gain insights into what their wants, needs, and habits are in order to provide better customer service and improve their financial revenues.
Picture a retail chain that sells clothing. Its marketing campaigns have been disastrous in the past few years. This is why they hire a data scientist who will help them create their next marketing campaign. The new hire, however, doesn’t have much knowledge on the product yet, therefore, cannot give in-depth insights. Here is where cluster analysis comes in!
The data scientist can create a scatter plot of all the chain retail’s customers depending on their age and the amount of money they spend in order to identify the target audience:
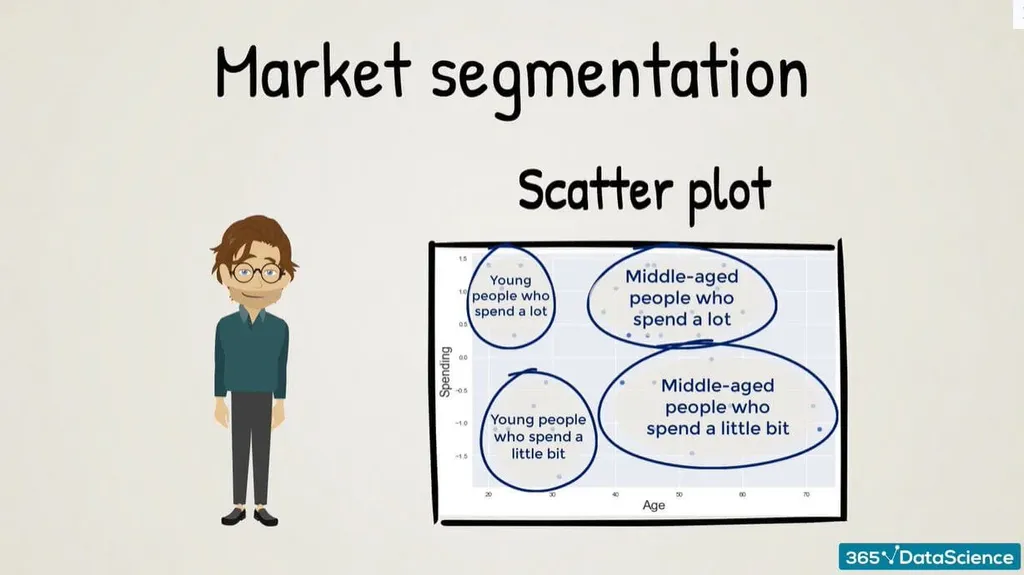
What the cluster analysis reveals is that there are 4 main groups:
- Young people who spend a lot
- Young people who spend less
- Middle-aged people who spend a lot
- Middle-aged people who spend less
One conclusion we can draw from this is that the retail chain should most probably aim its marketing at middle-aged people as they make up most of the data points.
Of course, cluster analysis is rarely the sole method used for drawing conclusions. However, it is a great starting point.
Image Segmentation
A more interesting and definitely more visual cluster analysis example is image segmentation. To define the characteristics of this application, we’ll look at a photo:
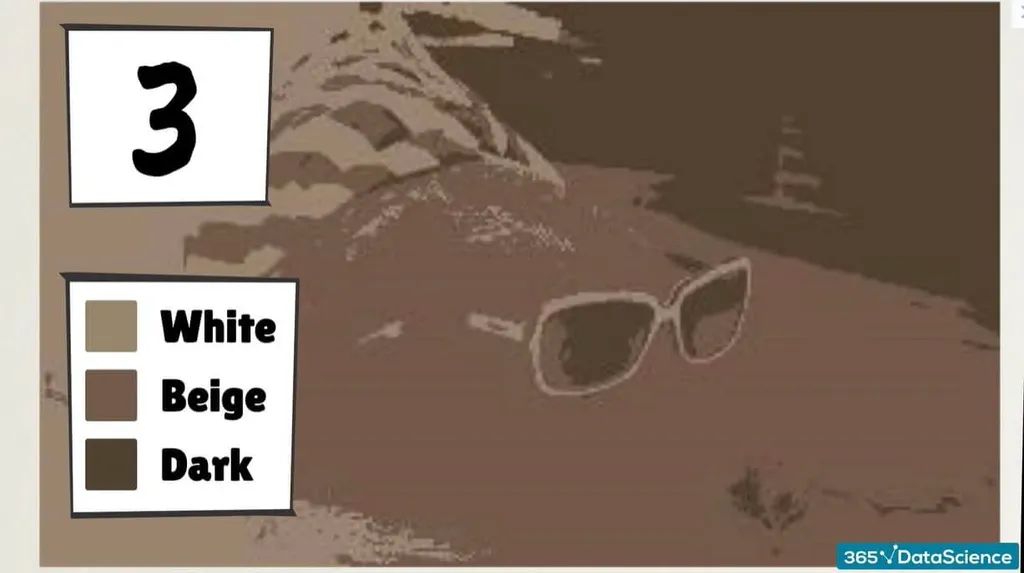
It’s quite difficult to differentiate the different aspects of the photo. Each colour is located in a different cluster– white, beige, and dark brown. They’re not enough, however, so everything blends together.
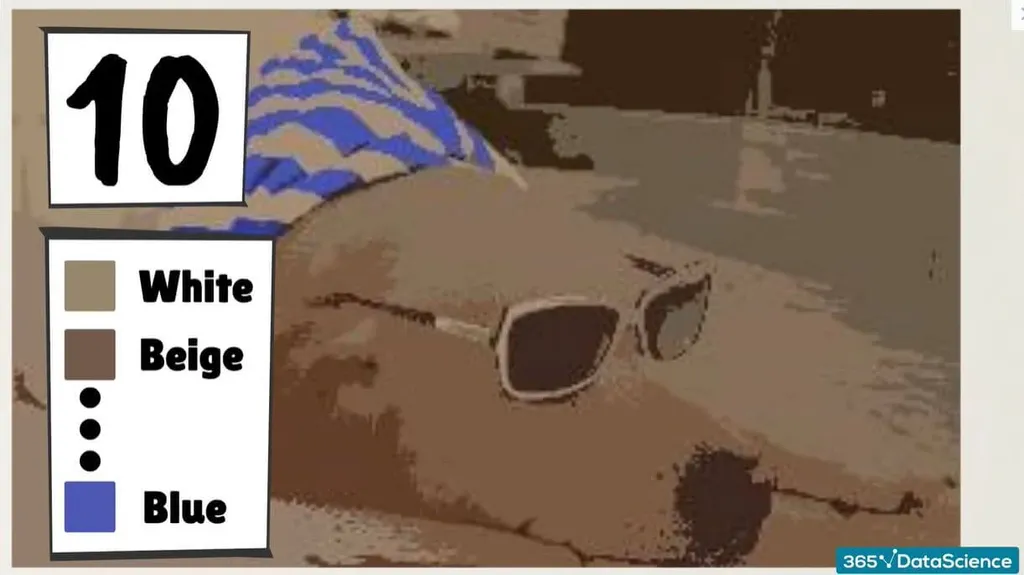
Here, we have 10 distinct clusters. There is already enough detail to see that it is actually a dog laying on the ground. Moreover, the color of the bandana is now prominent enough to actually preserve its blue color as a separate cluster.
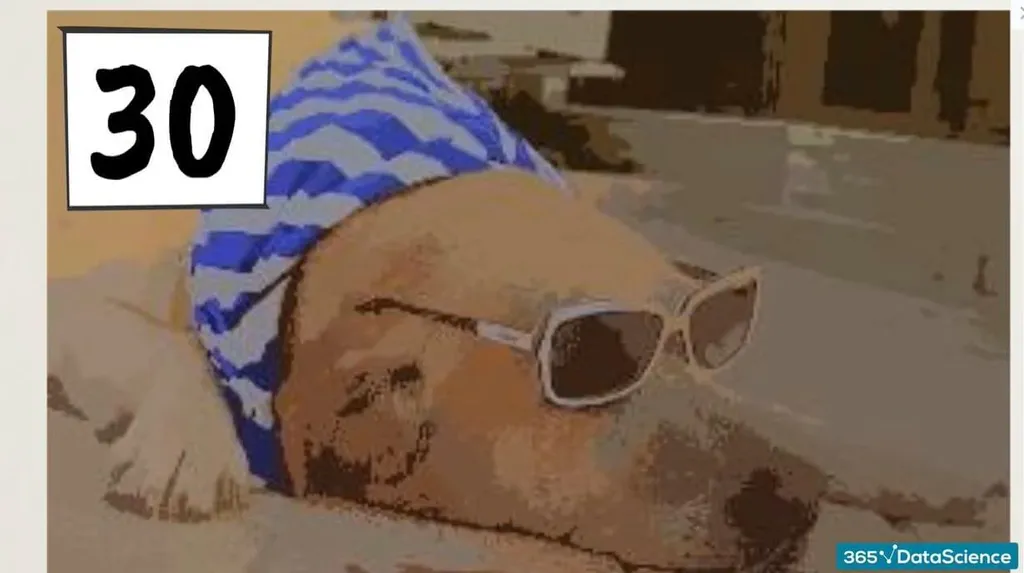
It becomes even clearer in this third photo that it’s of a dog in sunglasses and a bandana. The clusters this time around are 30. Although it seems like a small improvement, there are 3 times more colors than in the second photo. And we can already see details like the dog’s ear and the different nuances of its fur.
Here’s the original image:
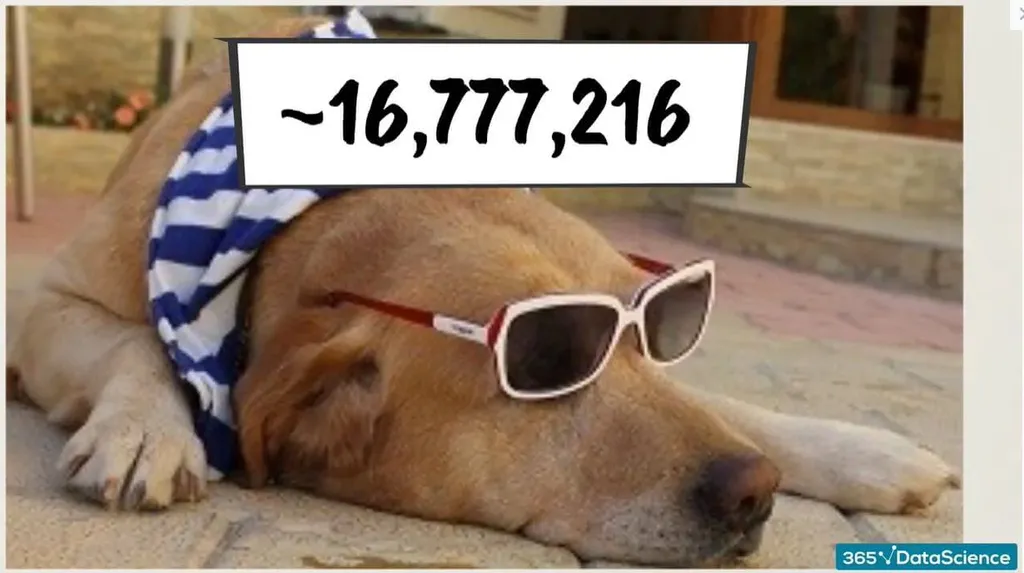
There are 16,777,216 possible colors in the RGB color model. So, to reproduce a whole image, we would need that many clusters. This does not mean that the colors will be perfect, however – some of them may blend, while others may invert.
Object Recognition
When running a Google Images search, the suggested images are presumably chosen through cluster analysis as the technique looks for similarities in colours, objects, etc. in order to recommend the most appropriate related images to the one you’re looking for.
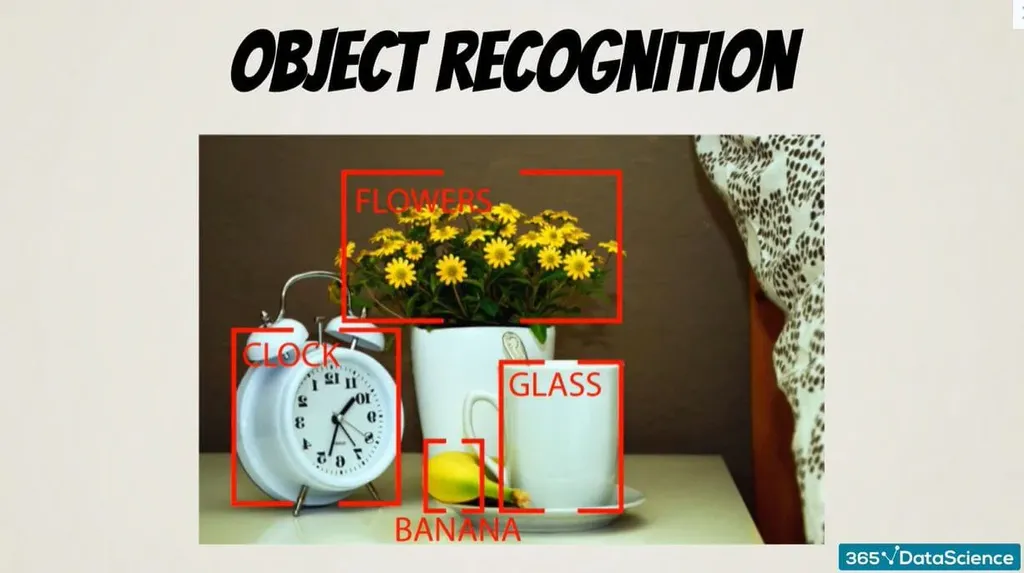
For a short period of time, we thought that we can apply clustering for object recognition in computer vision. However, in recent times, there have been much better techniques developed for training machines to detect the world around them, leaving cluster analysis to fall behind.
That is not to say you can’t still make use of its variety of applications – even image recognition.
Cluster Analysis: Next Steps
As we’ve seen, on the surface, clustering is extremely intuitive, but it can definitely be tricky. That being said, it’s still a very useful data science method that will help you advance in your field or improve your machine learning training.
Performing cluster analysis in programming languages such as Python is just one of the ways you can make use of its various applications – not to mention that it’s quite easy to learn, too. All in all, this method is versatile and a great gateway into machine learning.


