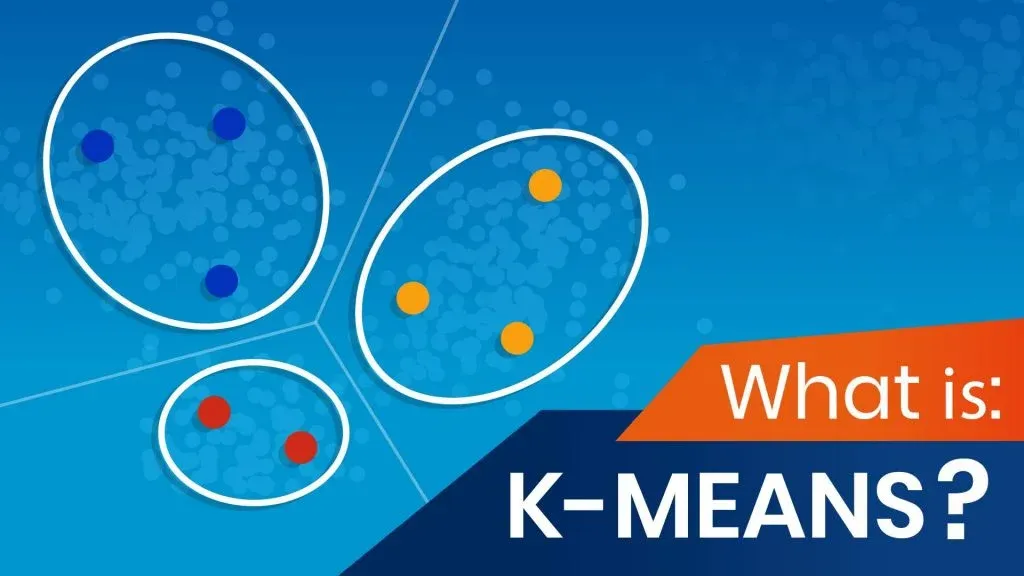
When trying to analyze data, one approach might be to look for meaningful groups or clusters. Clustering is dividing data into groups based on similarity. And K-means is one of the most commonly used methods in clustering. Why?
The main reason is its simplicity.
In this tutorial, we’ll start with the theoretical foundations of the K-means algorithm, we’ll discuss how it works and what pitfalls to avoid. Then, we’ll see a practical application of the K-means algorithm with Python using the sklearn library.
So, let’s get right into it and see what K-means is all about.
How Does K-means Clustering Work?
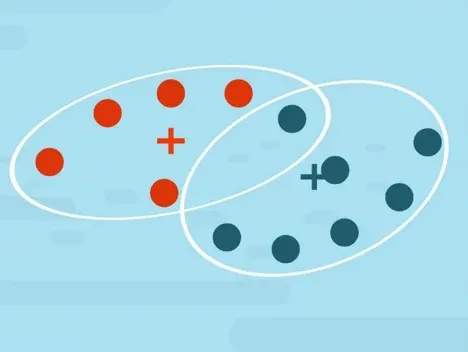
Let’s say we’d like to divide the following points into clusters.

First, we must choose how many clusters we’d like to have. The K in ‘K-means’ stands for the number of clusters we’re trying to identify. In fact, that’s where this method gets its name from. We can start by choosing two clusters.
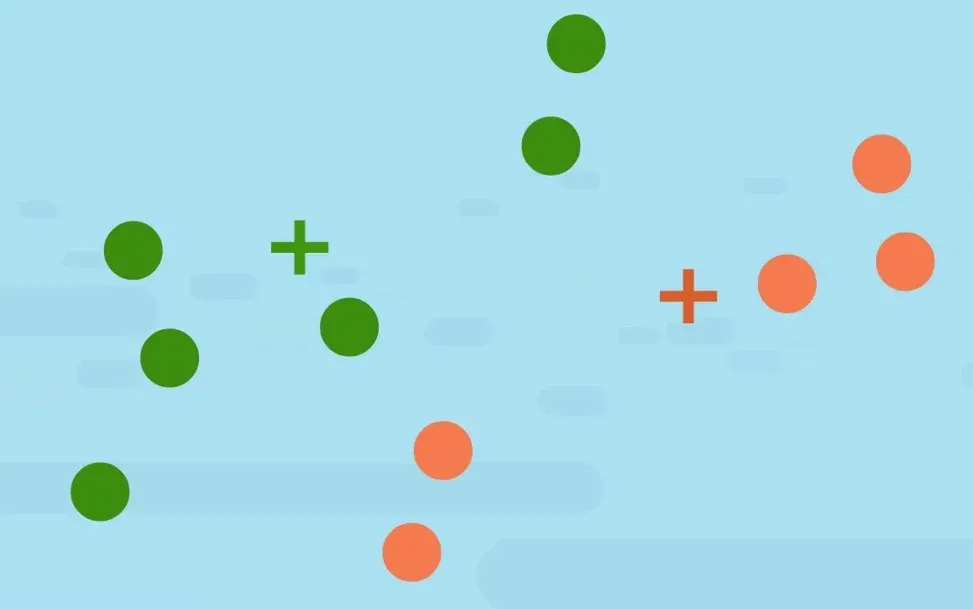
The second step is to specify the cluster seeds. A seed is basically a starting cluster centroid. It is chosen at random or is specified by the data scientist based on prior knowledge about the data.
One of the clusters will be the green cluster, and the other one - the orange cluster. And these are the seeds.

The next step is to assign each point on the graph to a seed. Which is done based on proximity.
For instance, this point is closer to the green seed than to the orange one. Therefore, it will belong to the green cluster.

This point, on the other hand, is closer to the orange seed, therefore, it will be a part of the orange cluster.

In this way, we can assign all points on the graph to a cluster, based on their Euclidean squared distance from the seeds.
The final step is to calculate the centroid or the geometrical center of the green points and the orange points.
The green seed will move closer to the green points to become their centroid and the orange will do the same for the orange points.
From here, we can repeat the last two steps. We can do that 10, 15 or 1000 times until we've reached a clustering solution where we can no longer adjust any of the clusters. 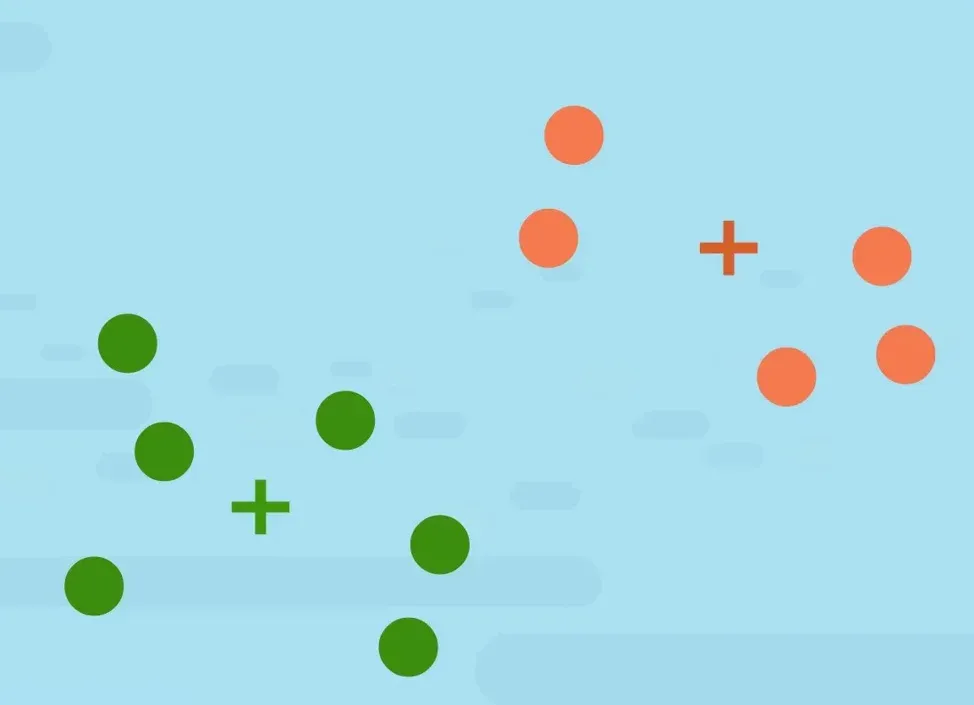
Sounds simple, right?
However, due to its simplicity, K-means is prone to some issues.
What Are the Disadvantages of K-means?
One disadvantage arises from the fact that in K-means we have to specify the number of clusters before starting. In fact, this is an issue that a lot of the clustering algorithms share. In the case of K-means if we choose K too small, the cluster centroid will not lie inside the clusters.

As we can see, in this example, this is not representative of the data. In cases where K is too large, some of the clusters may be split into two. Reasonable enough, right? Another important issue is that K-means enforces clusters with a spherical shape or blobs. The reason is that we are trying to minimize the distance from the centroids in a straight line. So, if we have clusters, which are more elongated, K-means will have difficulty separating them. 
Now that you’re familiar with what K-means is and how it works, let’s bring theory into practice with an example.
What’s K-Means Clustering’s Application?
One of K-means’ most important applications is dividing a data set into clusters. So, as an example, we’ll see how we can implement K-means in Python. To do that, we’ll use the sklearn library, which contains a number of clustering modules, including one for K-means. Let’s say we have our segmentation data in a csv file. After we’ve read the file (in our case using the pandas method) we can proceed with implementing K-means.

You’ll need to import ‘KMeans’ from ‘sklearn cluster’.

As mentioned above, K-means doesn’t tell us how many clusters there are. Instead, it minimizes the Euclidean norm.
However, we usually want to be able to determine the number of clusters, too, right?
Well, what if we assume there are 2 clusters and we calculate the sum of squared distances within each of the clusters? We can then assume we’ve got 3 clusters and do the same. Then we can compare the two and see how drastic the change is.
In reality, this is exactly what is done. Usually, we run the algorithm, say, 10 different times with 10 different number of clusters. We calculate the Within Cluster Sum of Squares or ‘W C S S’ for each of the clustering solutions. The WCSS is the sum of the variance between the observations in each cluster. It measures the distance between each observation and the centroid and calculates the squared difference between the two. Hence the name: within cluster sum of squares.
So, here’s how we use Within Cluster Sum of Squares values to determine the best clustering solution. 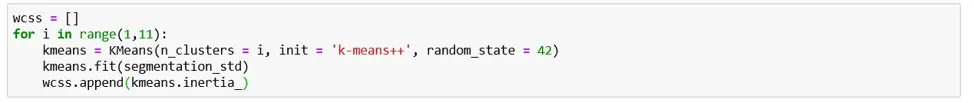
First, we need to initialize the Within Cluster Sum of Squares variable. It will begin life as an empty list. But there are worse faiths, I’m sure. Then we’ll run a for loop, trying out several clustering solutions, calculating their WCSS and adding the value to this list. The next step is determining the size of the loop.
How Many Iterations Do We Run?
Let’s run the code with 10 iterations. So, a range from one to eleven. You can try running the algorithm with a larger number. In this particular example, it wouldn’t improve the results, so, we’ll stick with 10. However, depending on the data you may need to increase the number of iterations.
In the loop, we run the K-means method. We set the number of clusters to ‘i’ and initialize with ‘K-means ++’. K-means ++ is an algorithm which runs before the actual k-means and finds the best starting points for the centroids.
The next item on the agenda is setting a random state. This ensures we’ll get the same initial centroids if we run the code multiple times.
Then, we fit the K-means clustering model using our standardized data. The statement fits a K-means clustering model with ‘i’ clusters to it.
And lastly, in each iteration, we add a value to the WCSS array. The WCSS is stored in the inertia attribute.
How to Choose the Number of Clusters?
The next step is to plot the results. We’ll plot ‘W C S S’ values against the number of clusters.
Here is the relevant code:
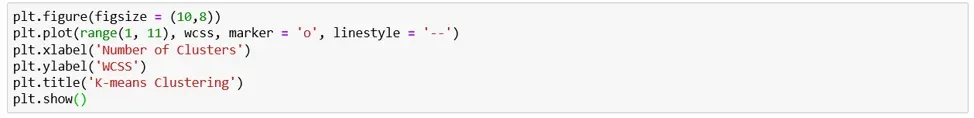
On the x-axis, we will have the range from 1 to 11. On the y-axis, we will have the WCSS variable.
You can also set a marker and line style for some added visual appeal. It’s up to you. And you can see in the picture bellow the result from executing the code: 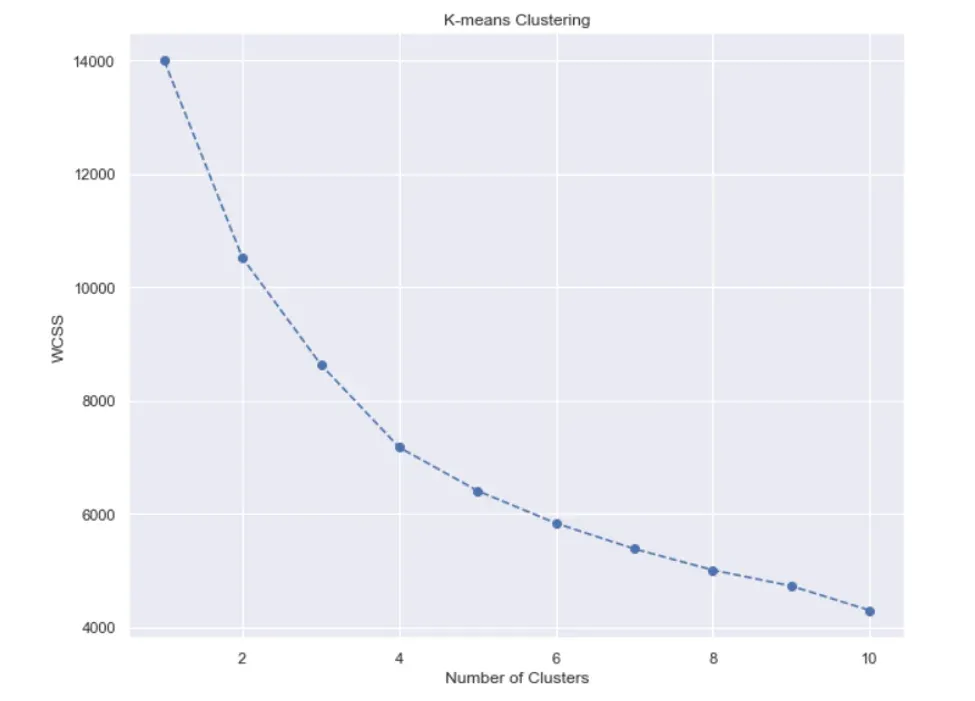
We have our plot, so let’s analyze it.
We see the function is monotonically decreasing. Sometimes it can be rapidly declining, other times – more smoothly. Depending on the shape of this graph, we make a decision about the number of clusters.
But how exactly do we choose how many clusters we want?
We’ll use an approach known as the ‘Elbow method’. As you can see, this graph looks like an arm with an elbow. The goal here is to spot the elbow itself and take that many clusters. Usually, the part of the graph before the elbow would be steeply declining, while the part after it – much smoother.
It seems we’ve got a clear winner: the Elbow on the graph is at the 4-cluster mark. This is the only place until which the graph is steeply declining, while smoothening out afterwards. 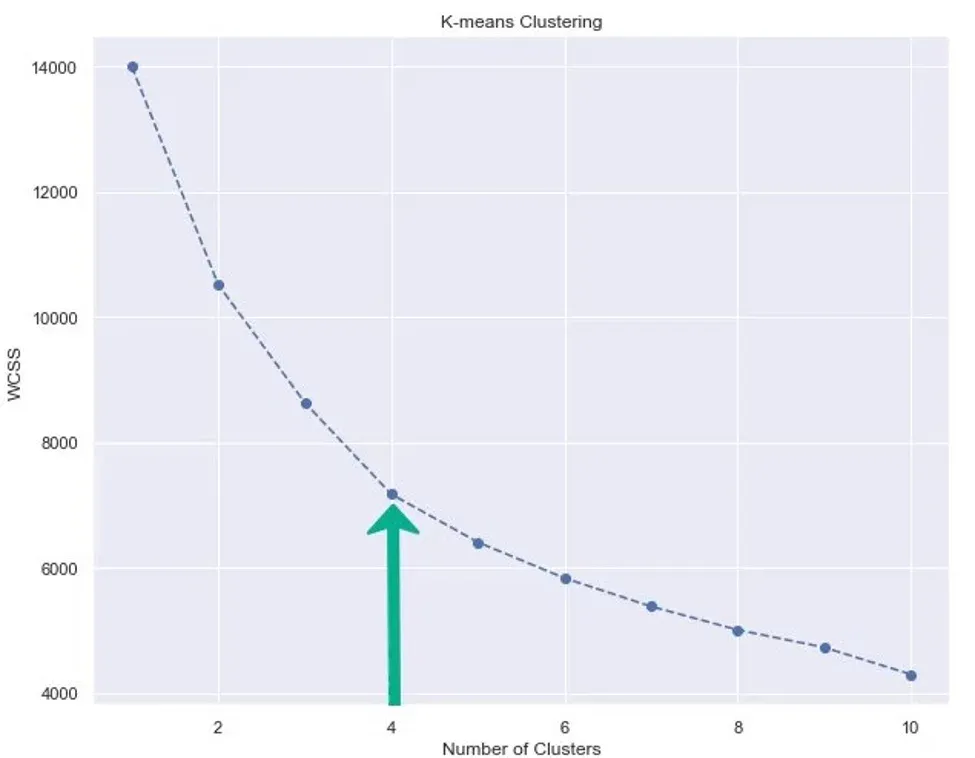
Note here, that because we have only four clusters, the algorithm with more than 10 will not yield an improvement in the results. But in cases where there are more clusters, a loop with more iterations should be performed.
Now we can perform K-means clustering with 4 clusters.

We initialize with K-means ++ again and we’ll use the same random state: 42. Finally, we must fit the data.
And that’s all you need to perform K-means Clustering in Python.
Hopefully, we shed some light on how K-means works and how to implement it in Python. You can learn more, check out Customer Analytics in Python course. Then take your skills to the next level with Machine Learning in Python.
If you’re looking to get familiar with other convenient libraries in Python, you can check out our post on PCA and get to know how to combine PCA and K-means clustering. In case you’re new to Python, and you’re enthusiastic to learn more, this super-detailed article on learning Python programming will guide you all the way from the installation, through Python IDEs, Libraries, and frameworks, to the best Python career paths and job outlook.
Ready to take the next step towards a career in data science?
Check out the complete Data Science Program today. Start with the fundamentals with our Statistics, Maths, and Excel courses, build up step-by-step experience with SQL, Python, R, and Tableau, and upgrade your skillset with Machine Learning, Deep Learning, Credit Risk Modeling, Time Series Analysis, and Customer Analytics in Python. If you still aren’t sure you want to turn your interest in data science into a solid career, we also offer a free preview version of the Data Science Program. You’ll receive 12 hours of beginner to advanced content for free. It’s a great way to see if the program is right for you.