Why Import Data Into Python?
One of the many applications of data science comes in the form of financial analysis.
And just like with any other quantitative analysis, we start with the data. We can pre-process it, alter it, model it, store it or remove it. But before we do any of that, we need to import it. So, in this tutorial, I’ll show you how to import data into Python.
We’ll start by learning how to use Pandas and import a fixed dataset from a CSV file or Excel file. Then we’ll see how to scrape data directly from Yahoo Finance.
Here’s why that’s important:
Data can be stored in various ways - we can have a file located on our machine or a cloud API. Each unique format is imported in a slightly different way, so we must be capable of using whatever data is given.
Sounds fun, right?
Let’s get started!
How To Import Data Into Python?
Before all else, to import data into Python, we need to load up Python first.
I prefer Jupyter, but you can use any of the other environments as well. Next, you need to import all the relevant packages. Here, that’s the “pandas” module, so we type “import pandas as pd”.
![]()
How To Load Data Into Python From A CSV File?
To import the data from the CSV file, we’ll create a “Data Frame” object using the “pandas” module.
We name the variable “raw_csv_data” and use it to record the values from the integrated function “read_csv” from the “pandas” package. Then, inside the parentheses, in double quotation marks, we add the name of the file. In our case, that is “Index 2018”.
![]()
Now, this is important.
Make sure you save the file in the same directory as your Python code. Otherwise, you’ll have to specify the path of the exact folder where you stored it. If you need to do that, just remember to use forward slashes when setting the appropriate directory, as backwards slashes serve a different purpose in Python.
Here’s how:
![]()
The “raw_csv_data” data frame now contains all the information from the CSV file we were interested in.
How To Import Data Into Python From An Excel File?
Alternatively, if the dataset we’re interested in is stored in an Excel spreadsheet instead, we can use the “read_excel” method the exact same way. ![]()
If you want to do financial analysis, you don’t want to miss the next part because there you'll learn how to import data into Python directly from Yahoo Finance.
How To Import Data Into Python From Yahoo Finance?
We’ll import data into Python by scraping the data off of Yahoo Finance using a very convenient library created by Ran Aroussi.
We’re going to use a completely new package for this task, called “yfinance”. Of course, the name comes from Yahoo Finance, where we’re taking the values from.
There’s just one problem.
This library is not pre-installed in Anaconda, so we need to pip – install it first.
If you need a hint on how to do that, you can open up the Anaconda Prompt and type in “pip install yfinance”. 
And, once you’re ready, you can use Jupyter to open the Python Notebook file attached to this tutorial.
Now Let me walk you through the rest of the steps.
Starting from the top, let’s quickly go over the code before us and see why we use it.
The first cell clearly imports the relevant package we need to load the data. 
The second cell imports another new library we haven’t seen before. Actually, this code just ignores the warnings Python might send in case it thinks you’re using the data incorrectly. Don’t worry, we’ve only added it as a precaution and won’t really need it here.

Next, we’re using the download method to scrape our data from the Yahoo Finance webpage. The comments below represent what each argument does and how to use it properly.

Let’s take a moment to examine the comments in cell 3 of the Python notebook, before we briefly go over what they do.
What Does The “Tickers” Argument Do?
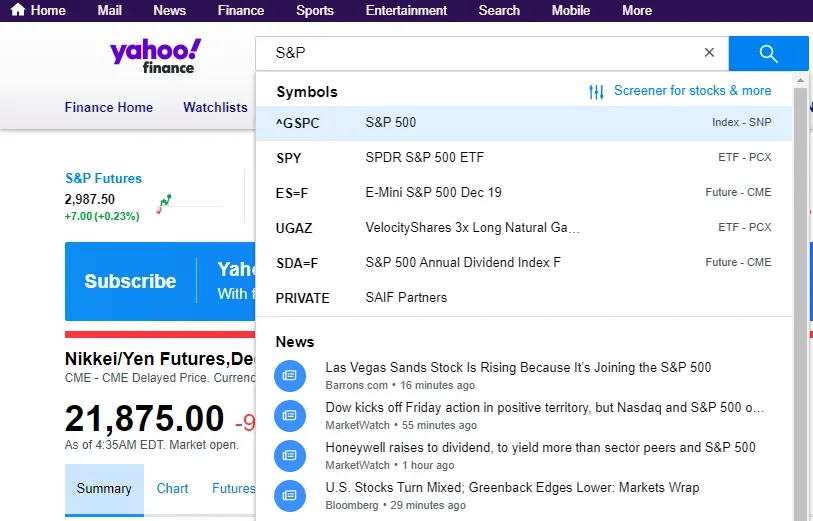
The “tickers” argument takes the names of the time series we wish to include. However, the names of the indexes don’t always match the way they’re stored in Yahoo Finance. For instance, the S&P 500 isn’t expressed with SPX as we’re used to, but rather “^GSPC”.
Thus, if you ever want to find the way a market index or a stock is stored in Yahoo Finance, simply go to the website and use the search bar as shown below. The bolded representation on the left gives us information on how these are stored and how we should type them up within the quotation marks.

What Do The “Start” and “End” Arguments Do?
The start and end arguments are pretty much self-explanatory. The only important factor here is the format of the dates. We’re using a YYYY/MM/DD format, so make sure to enter the correct start and end dates if you wish to switch them up.
What Does The “Interval” Argument Do?
The interval argument sets the frequency of the data. Since we’re using daily values, we set it equal to 1 day. 
What Does The “Group By” Argument Do?
The group_by argument groups all the data we’re importing based on the time series (tickers) it belongs to.
What About The “Auto Adjust” Column?
Well, the auto_adjust column simply replaces the closing prices with the adjusted closing prices based on the Open-High-Closing method. If we leave it as “False”, which is the default value, we’ll have Closing and Adjusted Closing Prices for each period of each time series. Therefore, we’re just limiting surplus data, since the adjusted closing prices is what we use in our analysis anyway.
How Does The “Treads” Argument Work?
Lastly, the treads argument is related to how we download the data when we’re dealing with massive amounts of data. Usually, leaving it as True is preferable.
How Do We Avoid Re-Scraping the Data When You Import Data Into Python?
Here, we’re just creating a copy of the data set, so that we don’t have to scrape it anew if we happen to remove or alter elements by accident. 
Since notation like “^GDAXI” or “^N225” can be extremely confusing, we decide to add new columns to our data frame with the names we’re familiar with from our original data set. Of course, as stated before, we’re only using the closing prices, so we solely need the “Close” attributes of each time series.

What we do next is to remove the first elements of each time series, because of how the download method is coded. Due to the fact that the closing and opening times vary when the data is stored, the dataset always starts 1 period before the “start” argument we set.

After taking care of that, we remove the surplus data. Since we already stored the closing prices in the new columns we created, we can get rid of the original series we scraped from the site.
Of course, the last two lines of the 6th cell once again set the frequency and handle any missing values.
Now, the 7th cell in the code is only there to see how we’ve done so far. The “head method” helps us make sure the initial elements of our data set are the same as the ones from the CSV file. The “tail method” is there to make sure we’ve correctly included all the data up to the period we are interested in.

And, as a final note, keep in mind that in practice, we also need to remove the surplus data and split it into a training and a testing set.
In Conclusion - Additional Resources
Now that you know how to get whatever data you wish from Yahoo Finance and how to import it into Python, you can play around and use any data you are interested in, without being confounded to the one we provide you with.
So, if you want to learn more about using this new package, you can find more details here. https://pypi.org/project/yfinance/
***
If you’re enthusiastic about boosting your Python knowledge, check out our Introduction to Python course.
Ready To Start Learning Data Science?
Check out the complete Data Science Program today. Start with the fundamentals with our Statistics, Maths, and Excel courses. Build up step-by-step experience with SQL, Python, R, and Tableau. And upgrade your skillset with Machine Learning, Deep Learning, Credit Risk Modeling, Time Series Analysis, and Customer Analytics in Python. If you still aren’t sure you want to turn your interest in data science into a solid career, we also offer a free preview version of the Data Science Program. You’ll receive 12 hours of beginner to advanced content for free. It’s a great way to see if the program is right for you.


